Quantcast
Channel: Blog – Sumo Logic
Viewing all 1036 articles
Browse latest View live

How Hudl and Cloud Cruiser use Sumo Logic Unified Logs and Metrics

$
0
0

We launched the Sumo Logic Unified Logs and Metrics (ULM) solution a couple of weeks ago, and we already are seeing massive success and adoption of this solution. So how are how real-world customers using the Sumo Logic ULM product?

Today, we ran a webinar with a couple of our early ULM product customers and got an inside view into their processes, team makeup, and how ULM is changing the way they monitor and troubleshoot. The webinar was hosted by Ben Newton, Sumo Logic Product Manager extraordinaire for ULM, and featured two outstanding customer speakers: Ben Abrams, Lead DevOps Engineer, Cloud Cruiser, and Jon Dokulil, VP of Engineering, Hudl.

Ben and Jon both manage mission-critical AWS-based applications for their organizations and are tasked with ensuring excellent customer experience. Needless to say, they know application and infrastructure operations well.

In the webinar, Ben and Jon described their current approaches to operations (paraphrased below for readability and brevity):

Jon: Sumo Logic log analytics is a critical part of the day to day operations at Hudl. Hudl engineers use Sumo Dashboards to identify issues when they deploy apps; they also use Sumo Logic reports extensively to troubleshoot application and infrastructure performance issues.

Ben: Everything in our world starts with an alert. And before ULM, we had to use many  systems to correlate the data. We use Sumo Logic extensively in the troubleshooting process.

Ben and Jon also described their reasons to consider Sumo Logic ULM:

Ben: Both logs and metrics tell critical parts of the machine data story and we want to see them together in one single pane of glass so that we can correlate the data better and faster and reduce our troubleshooting time. Sumo Logic ULM provides this view to us.

Jon: We have many tools serving the DevOps team, and the team needs to check many systems when things go wrong and not all team members are skilled in all tools. Having a single tool that can help diagnose problems is better, so consolidating across logs and metrics has provided us significant value.

Hudl

ULM Dashboards at Hudl

Finally, the duo explains where they want to go with Sumo Logic ULM:

Ben: We would like to kill off our siloed metrics solution. We would also like to use AWS auto-scale policies to automate the remediation process, without human intervention.

Jon: We would like to provide full log and metrics visibility with the IT alerts so that the DevOps team can get full context and visibility to fix issues quickly.

All in all, this was a fantastic discussion and it validates why IT shops that are tasked with 100% performance SLA’s should consider Sumo Logic Unified Logs and Metrics solution. To hear the full story, check out the full webinar on-demand.
If you are interested in trying out Sumo Logic ULM solution, sign up for Sumo Logic Free.


Tutorial: How to Run Artifactory as a Container

$
0
0

If you use Artifactory, JFrog’s artifact repository manager, there’s a good chance you’re already invested in a DevOps-inspired workflow. And if you do DevOps, you’re probably interested in containerizing your apps and deploying them through Docker or another container system. That’s a key part of being agile, after all.

From this perspective, it only makes sense to want to run Artifactory as a Docker container. Fortunately, you can do that easily enough. While Artifactory is available for installation directly on Linux or Windows systems, it can also run easily enough on Docker. In fact, running Artifactory as a container gives you some handy features that would not otherwise be available.

In this tutorial, I’ll explain how to run Artifactory as a container, and discuss some of the advantages of running it this way.

Pulling the Artifactory Container

Part of the reason why running Artifactory as a Docker container is convenient is that pre-built images for it already exist. The images come with the Nginx Web server and Docker repositories built in.

The Artifactory container images are available from Bintray. You can pull them with a simple Docker pull command, like so:

docker pull docker.bintray.io/jfrog/artifactory-oss:latest

This would pull the image for the latest version of the open source edition of Artifactory. If you want a different version, you can specify that in the command. Images are also available for the Pro Registry and Pro versions of Artifactory.

Running Artifactory as a Container

Once you’ve pulled the container image, start it up. A command like this one would do the trick:


docker run -d --name artifactory -p 80:80 -p 8081:8081 -p 443:443 \
-v $ARTIFACTORY_HOME/data \
-v $ARTIFACTORY_HOME/logs \
-v $ARTIFACTORY_HOME/backup \
-v $ARTIFACTORY_HOME/etc \
docker.bintray.io/jfrog/artifactory-oss:latest

The -v flags specify volume mounts to use. You could use whichever volume mounts you like, but the ones specified above follow JFrog’s suggestions. To configure them correctly, you should run


export ARTIFACTORY_HOME=/var/opt/jfrog/artifactory

prior to starting the Artifactory container, so that the ARTIFACTORY_HOME environment variable is set correctly.

Configuring the Client

Artifactory is now up and running as a container. But there’s a little extra tweaking you need to do to make it accessible on your local machine.

In particular, edit /etc/hosts so that it includes this line:

localhost docker-virtual.art.local docker-dev-local2.art.local docker-prod-local2.art.local

Also run:

DOCKER_OPTS="$DOCKER_OPTS --insecure-registry \ docker-virtual.art.local --insecure-registry \
docker-dev-local2.art.local --insecure-registry \
docker-prod-local2.art.local --insecure-registry \
docker-remote.art.local"

This command tells Docker to work with a self-signed certificate. It’s necessary because the Artifactory container image has a self-signed certificate built in. (You would want to change this if you were running Artifactory in production, of course.)

After this, restart Docker and you’re all set. Artifactory is now properly configured, and accessible from your browser at http://localhost:8081/artifactory.

Why run Artifactory as a Container?

Before wrapping up the tutorial, let’s go over why you might want to run Artifactory as a container in the first place. Consider the following benefits:

  • It’s easy to install. You don’t have to worry about configuring repositories or making your Linux distribution compatible with the Artifactory packages. You can simply install Docker, then run the Artifactory package.
  • It’s easy to get a particular version. Using RPM or Debian packages, pulling a particular version of an app (and making sure the package manager doesn’t automatically try to update it) can be tricky. With the container image, it’s easy to choose whichever version you want.
  • It’s more secure and isolated. Rather than installing Artifactory to your local file system, you keep everything inside a container. That makes removing or upgrading clean and easy.
  • It’s easy to add to a cluster. If you want to make Artifactory part of a container cluster and manage it with Kubernetes or Swarm, you can do that in a straightforward way by running it as a container.

How to Run Artifactory as a Container is published by the Sumo Logic DevOps Community. If you’d like to learn more or contribute, visit devops.sumologic.com. Also, be sure to check out Sumo Logic Developers for free tools and code that will enable you to monitor and troubleshoot applications from code to production.

About the Author

Chris tozzi on npm artifactoryChris Tozzi has worked as a journalist and Linux systems administrator. He has particular interests in open source, agile infrastructure and networking. He is Senior Editor of content and a DevOps Analyst at Fixate IO.

5 Bintray Security Best Practices

$
0
0

Bintray, JFrog’s software hosting and distribution platform, offers lots of exciting features, like CI integration and REST APIs.

If you’re like me, you enjoy thinking about those features much more than you enjoy thinking about software security. Packaging and distributing software is fun; worrying about the details of Bintray security configurations and access control for your software tends to be tedious (unless security is your thing, of course).

Like any other tool, however, Bintray is only effective in a production environment when it is run securely. That means that, alongside all of the other fun things you can do with Bintray, you should plan and run your deployment in a way that mitigates the risk of unauthorized access, the exposure of private data, and so on.

Below, I explain the basics of Bintray security, and outline strategies for making your Bintray deployment more secure.

Bintray Security Basics

Bintray is a cloud service hosted by JFrog’s data center provider. JFrog promises that the service is designed for security, and hardened against attack. (The company is not very specific about how it mitigates security vulnerabilities for Bintray hosting, but I wouldn’t be either, since one does not want to give potential attackers information about the configuration.) JFrog also says that it restricts employee access to Bintray servers and uses SSH over VPN when employees do access the servers, which adds additional security.

The hosted nature of Bintray means that none of the security considerations associated with on-premises software apply. That makes life considerably easier from the get-go if you’re using Bintray and are worried about security.

Still, there’s more that you can do to ensure that your Bintray deployment is as robust as possible against potential intrusions. In particular, consider adopting the following policies.

Set up an API key for Bintray

Bintray requires users to create a username and password when they first set up an account. You’ll need those when getting started with Bintray.

Once your account is created, however, you can help mitigate the risk of unauthorized access by creating an API key. This allows you to authenticate over the Bintray API without using your username or password. That means that even if a network sniffer is listening to your traffic, your account won’t be compromised.

Use OAuth for Bintray Authentication

Bintray also supports authentication using the OAuth protocol. That means you can log in using credentials from a GitHub, Twitter or Google+ account.

Chances are that you pay closer attention to one of these accounts (and get notices from the providers about unauthorized access) than you do to your Bintray account. So, to maximize security and reduce the risk of unauthorized access, make sure your Bintray account itself has login credentials that cannot be brute-forced, then log in to Bintray via OAuth using an account from a third-party service that you monitor closely.

Sign Packages with GPG

Bintray supports optional GPG signing of packages. To do this, you first have to configure a key pair in your Bintray profile. For details, check out the Bintray documentation.

GPG signing is another obvious way to help keep your Bintray deployment more secure. It also keeps the users of your software distributions happier, since they will know that your packages are GPG-signed, and therefore, are less likely to contain malicious content.

Take Advantage of Bintray’s Access Control

The professional version of Bintray offers granular control over who can download packages. (Unfortunately this feature is only available in that edition.) You can configure access on a per-user or per-organization basis.

While gaining Bintray security shouldn’t be the main reason you use granular access control (the feature is primarily designed to help you fine-tune your software distribution), it doesn’t hurt to take advantage of it in order to reduce the risk that certain software becomes available to a user to whom you don’t want to give access.

5 Bintray Security Best Practices is published by the Sumo Logic DevOps Community. If you’d like to learn more or contribute, visit devops.sumologic.com. Also, be sure to check out Sumo Logic Developers for free tools and code that will enable you to monitor and troubleshoot applications from code to production.

About the Author

Chris Tozzi has worked as a journalist and Linux systems administrator. He has particular interests in open source, agile infrastructure and networking. He is Senior Editor of content and a DevOps Analyst at Fixate IO.

Getting Started with AWS Kinesis Streams

$
0
0

Sumo Logic Kinesis ConnectorIn December 2013, Amazon Web Services released Kinesis, a managed, dynamically scalable service for the processing of streaming big data in real-time. Since that time, Amazon has been steadily expanding the regions in which Kinesis is available, and as of this writing, it is possible to integrate Amazon’s Kinesis producer and client libraries into a variety of custom applications to enable real-time processing of streaming data from a variety of sources.

Kinesis acts as a highly available conduit to stream messages between data producers and data consumers. Data producers can be almost any source of data: system or web log data, social network data, financial trading information, geospatial data, mobile app data, or telemetry from connected IoT devices. Data consumers will typically fall into the category of data processing and storage applications such as Apache Hadoop, Apache Storm, and Amazon Simple Storage Service (S3) and ElasticSearch.

Understanding Key Concepts in Kinesis

It is helpful to understand some key concepts when working with Kinesis Streams.

Kinesis Stream Shards

The basic unit of scale when working with streams is a shard. A single shard is capable of ingesting up to 1MB or 1,000 PUTs per second of streaming data, and emitting data at a rate of 2MB per second.

Shards scale linearly, so adding shards to a stream will add 1MB per second of ingestion, and emit data at a rate of 2MB per second for every shard added. Ten shards will scale a stream to handle 10MB (10,000 PUTs) of ingress, and 20MB of data egress per second. You choose the number of shards when creating a stream, and it is not possible to change this via the AWS Console once you’ve created a stream.

It is possible to dynamically add or remove shards from a stream using the AWS Streams API. This is called resharding. Resharding cannot be done via the AWS Console, and is considered an advanced strategy when working with Kinesis. A solid understanding of the subject is required prior to attempting these operations.

Adding shards essentially splits shards in order to scale the stream, and removing shards merges them. Data is not discarded when adding (splitting) or removing (merging) shards. It is not possible to split a single shard into more than two, nor to merge more than two shards into a single shard at a time.

Adding and removing shards will increase or decrease the cost of your stream accordingly. Per the Amazon Kinesis Streams FAQ, there is a default limit of 10 shards per region. This limit can be increased by contacting Amazon Support and requesting a limit increase. There is no limit to the number of shards or streams in an account.

Types of Shards

Records are units of data stored in a stream and are made up of a sequence number, partition key, and a data blob. Data blobs are the payload of data contained within a record. The maximum size of a data blob before Base64-encoding is 1MB, and is the upper limit of data that can be placed into a stream in a single record. Larger data blobs must be broken into smaller chunks before putting them into a Kinesis stream.

Partition keys are used to identify different shards in a stream, and allow a data producer to distribute data across shards.

Sequence numbers are unique identifiers for records inserted into a shard. They increase monotonically, and are specific to individual shards.

Amazon Kinesis Offerings

Amazon Kinesis is currently broken into three separate service offerings.

Kinesis Streams is capable of capturing large amounts of data (terabytes per hour) from data producers, and streaming it into custom applications for data processing and analysis. Streaming data is replicated by Kinesis across three separate availability zones within AWS to ensure reliability and availability of your data.

Kinesis Streams is capable of scaling from a single megabyte up to terabytes per hour of streaming data. You must manually provision the appropriate number of shards for your stream to handle the volume of data you expect to process. Amazon helpfully provides a shard calculator when creating a stream to correctly determine this number. Once created, it is possible to dynamically scale up or down the number of shards to meet demand, but only with the AWS Streams API at this time.

It is possible to load data into Streams using a number of methods, including HTTPS, the Kinesis Producer Library, the Kinesis Client Library, and the Kinesis Agent.

By default, data is available in a stream for 24 hours, but can be made available for up to 168 hours (7 days) for an additional charge.

Monitoring is available through Amazon Cloudwatch. If you want to add more verbose visualizations of that data, you can use Sumo Logic’s open source Kinesis Connector to fetch data from the Kinesis Stream and send it to the Sumo Logic service. Kinesis Connector is a Java connector that acts as a pipeline between an [Amazon Kinesis] stream and a [Sumologic] Collection. Data gets fetched from the Kinesis Stream, transformed into a POJO and then sent to the Sumologic Collection as JSON.

Kinesis Firehose is Amazon’s data-ingestion product offering for Kinesis. It is used to capture and load streaming data into other Amazon services such as S3 and Redshift. From there, you can load the streams into data processing and analysis tools like Elastic Map Reduce, and Amazon Elasticsearch Service. It is also possible to load the same data into S3 and Redshift at the same time using Firehose.

Firehose can scale to gigabytes of streaming data per second, and allows for batching, encrypting and compressing of data. It should be noted that Firehose will automatically scale to meet demand, which is in contrast to Kinesis Streams, for which you must manually provision enough capacity to meet anticipated needs.

As with Kinesis Streams, it is possible to load data into Firehose using a number of methods, including HTTPS, the Kinesis Producer Library, the Kinesis Client Library, and the Kinesis Agent. Currently, it is only possible to stream data via Firehose to S3 and Redshift, but once stored in one of these services, the data can be copied to other services for further processing and analysis.

Monitoring is available through Amazon Cloudwatch.

Kinesis Analytics is Amazon’s forthcoming product offering that will allow running of standard SQL queries against data streams, and send that data to analytics tools for monitoring and alerting.

This product has not yet been released, and Amazon has not published details of the service as of this date.

Kinesis Pricing

Here’s a pricing guide for the various Kinesis offerings.

Kinesis Streams

There are no setup or minimum costs associated with using Amazon Kinesis Streams. Pricing is based on two factors — shard hours, and PUT Payload Units, and will vary by region. US East (Virginia), and US West (Oregon) are the least expensive, while regions outside the US can be significantly more expensive depending on region.

At present, shard hours in the US East (Virginia) region are billed at $0.015 per hour, per shard. If you have 10 shards, you would be billed at a rate of $0.15 per hour.

PUT Payload Units are counted in 25KB chunks. If a record is 50KB, then you would be billed for two units. If a record is 15KB, you will be billed for a single unit. Billing per 1 million units in the US East (Virginia) region is $0.014.

Extended Data Retention for up to 7 days in the US East (Virginia) region is billed at $0.020 per shard hour. By default, Amazon Kinesis stores your data for 24 hours. You must enable Extended Data Retention via the Amazon API.

Kinesis Streams is not available in the AWS Free Tier. For more information and pricing examples, see Amazon Kinesis Streams Pricing.

Kinesis Firehose

There are also no setup or minimum costs associated with using Amazon Kinesis Firehose. Pricing is based on a single factor — data ingested per GB. Data ingested by Firehose in the US East (Virginia) region is billed at $0.035 per GB.

You will also be charged separately for data ingested by Firehose and stored in S3 or Redshift. Kinesis Firehose is not available in the AWS Free Tier. For more information and pricing examples, see Amazon Kinesis Firehose Pricing.

Kinesis vs SQS

Amazon Kinesis is differentiated from Amazon’s Simple Queue Service (SQS) in that Kinesis is used to enable real-time processing of streaming big data. SQS, on the other hand, is used as a message queue to store messages transmitted between distributed application components.

Kinesis provides routing of records using a given key, ordering of records, the ability for multiple clients to read messages from the same stream concurrently, replay of messages up to as long as seven days in the past, and the ability for a client to consume records at a later time. Kinesis Streams will not dynamically scale in response to increased demand, so you must provision enough streams ahead of time to meet the anticipated demand of both your data producers and data consumers.

SQS provides for messaging semantics so that your application can track the successful completion of work items in a queue, and you can schedule a delay in messages of up to 15 minutes. Unlike Kinesis Streams, SQS will scale automatically to meet application demand. SQS has lower limits to the number of messages that can be read or written at one time compared to Kinesis, so applications using Kinesis can work with messages in larger batches than when using SQS.

Competitors to Kinesis

There are a number of products and services that provide similar feature sets to Kinesis. Three well-known options are summarized below.

Apache Kafka is a high performance message broker originally developed by LinkedIn, and now a part of the Apache Software Foundation. It is downloadable software written in Scala. There are quite a few opinions as to whether one should choose Kafka or Kinesis, but there are some simple use cases to help make that decision.

If you are looking for an on-prem solution, consider Kafka since you can set up and manage it yourself. Kafka is generally considered more feature-rich and higher- performance than Kinesis, and offers the flexibility that comes with maintaining your own software. On the other hand, you must set up and maintain your own Kafka cluster(s), and this can require expertise that you may not have available in-house.

It is possible to set up Kafka on EC2 instances, but again, that will require someone with Kafka expertise to configure and maintain. If your use case requires a turnkey service that is easy to set up and maintain, or integrate with other AWS services such as S3 or Redshift, then you should consider Kinesis instead.

There are a number of comparisons on the web that go into more detail about features, performance, and limitations if you’re inclined to look further.

Microsoft Azure Event Hubs is Microsoft’s entry in the streaming messaging space. Event Hubs is a managed service offering similar to Kinesis. It supports AMQP 1.0 in addition to HTTPS for reading and writing of messages. Currently, Kinesis only supports HTTPS and not AMQP 1.0. (There is an excellent comparison of Azure Event Hubs vs Amazon Kinesis if you are looking to see a side-by-side comparison of the two services.)

Google Cloud Pub/Sub is Google’s offering in this space. Pub/Sub supports both HTTP access, as well as gRPC (alpha) to read and write streaming data.

At the moment, adequate comparisons of this service to Amazon Kinesis (or Azure Event Hubs) are somewhat lacking on the web. This is expected; Google only released version 1 of this product in June of 2015. Expect to see more sometime in the near future.

Google provides excellent documentation on using the service in their Getting Started guide.
Beginner Resources for Kinesis

Amazon has published an excellent tutorial on getting started with Kinesis in their blog post Building a Near Real-Time Discovery Platform with AWS. It is recommended that you give this a try first to see how Kinesis can integrate with other AWS services, especially S3, Lambda, Elasticsearch, and Kibana.

Once you’ve taken Kinesis for a test spin, you might consider integrating with an external service such as SumoLogic to analyze log files from your EC2 instances using their Amazon Kinesis Connector. (The code has been published in the SumoLogic Github repository.)

Getting Started with AWS Kinesis Streams is published by the Sumo Logic DevOps Community. If you’d like to learn more or contribute, visit devops.sumologic.com. Also, be sure to check out Sumo Logic Developers for free tools and code that will enable you to monitor and troubleshoot applications from code to production.

About the Author

Steve Tidwell has been working in the tech industry for over two decades, and has done everything from end-user support to scaling a global data ingestion and analysis platform to handle data analysis for some of the largest streaming events on the Web. He is currently Lead Architect for a well-known tech news site, where he plots to take over the world with cloud based technologies from his corner of the office.

Resources

Integrating Apps with the Sumo Logic Search API

$
0
0

Sumo Logic Search Job APIThe Sumo Logic Web app provides a search interface that lets you parse logs. This provides a great resource for a lot of use cases — especially because you can take advantage of a rich search syntax, including wildcards and various operators (documented here), directly from the Web app.

But we realize that some people need to be able to harness Sumo Logic search data from within external apps, too. That’s why Sumo Logic also provides a robust RESTful API that you can use to integrate other apps with Sumo Logic search.

To provide a sense of how you can use the Sumo Logic Search Job API in the real world, this post offers a quick primer on the API, along with a couple of examples of the API in action. For more detailed information, refer to the Search Job API documentation.

Sumo Logic Search Integration: The Basics

Before getting started there are a few essentials you should know about the Sumo Logic Search Job API.

First, the API uses the HTTP GET method. That makes it pretty straightforward to build the API into Web apps you may have (or any other type of app that uses the HTTP protocol). It also means you can run queries directly from the CLI using any tool that supports HTTP GET requests, like curl or wget. Sound easy? It is!

Second, queries should be directed to https://api.sumologic.com/api/v1/logs/search. You simply append your GET requests and send them on to the server. (You also need to make sure that your HTTP request contains the parameters for connecting to your Sumo Logic account; for example, with curl, you would specify these using the -u flag, for instance, curl -u user@example.com:VeryTopSecret123 your-search-query).

Third, the server delivers query responses in JSON format. That approach is used because it keeps the search result data formatting consistent, allowing you to manipulate the results easily if needed.

Fourth, know that the Search Job API can return up to one million records per search query. API requests are limited to  four API per second and 240 requests per minute across all API calls from a customer. If the rate is exceeded, a rate limit exceeded (429) error is returned.


Sumo Logic Search API Example Queries

As promised, here are some real-world examples.

For starters, let’s say you want to identify incidents where a database connection failure occurred. To do this, specify “database connection error” as our query, using a command like this:


curl -u user@example.com:VeryTopSecret123 "https://api.sumologic.com/api/v1/logs/search?q=database connection error"

(That’s all one line, by the way.)

You can take things further, too, by adding date and time parameters to the search. For example, if you wanted to find database connection errors that happened between about 1 p.m. and 3 p.m. on April 4, 2012, you would add some extra data to your query, making it look like this:


curl -u user@example.com:VeryTopSecret123 "https://api.sumologic.com/api/v1/logs/search?q=database connection error&from=2012-04-04T13:01:02&to=2012-04-04T15:01:02

Another real-world situation where the search API can come in handy is to find login failures. You could locate those in the logs with a query like this:


curl -u user@example.com:VeryTopSecret123 "https://api.sumologic.com/api/v1/logs/search?q=failed login"

Again, you could restrict your search here to a certain time and date range, too, if you wanted.

Another Way to Integrate with Sumo Logic Search: Webhooks

Most users will probably find the Sumo Logic search API the most extensible method of integrating their apps with log data. But there is another way to go about this, too, which is worth mentioning before we wrap up.

That’s Webhook alerts, a feature that was added to Sumo Logic last fall. Webhooks make it easy to feed Sumo Logic search data to external apps, like Slack, PagerDuty, VictorOps and Datadog. I won’t explain how to use Webhooks in this post, because that topic is already covered on our blog.

Integrating Apps with the Sumo Logic Search API is published by the Sumo Logic DevOps Community. If you’d like to learn more or contribute, visit devops.sumologic.com. Also, be sure to check out Sumo Logic Developers for free tools and code that will enable you to monitor and troubleshoot applications from code to production.

About the Author

Dan Stevens is the founder of StickyWeb (stickyweb.biz), a custom Web Technology development company. Previously, he was the Senior Product Manager for Java Technologies at Sun Microsystems and for broadcast video technologies at Sony Electronics, Accom and Ampex.

How to Configure a Docker Cluster Using Swarm

$
0
0

Docker swarm configurationIf your data center were a beehive, Docker Swarm would be the pheromone that keeps all the bees working efficiently together.

Here’s what I mean by that. In some ways, Docker containers are like bumblebees. Just as an individual bee can’t carry much of anything on her own, a single container won’t have a big impact on your data center’s bottom line.

It’s only by deploying hundreds or thousands of containers in tandem that you can leverage their power, just like a colony of bees prospers because of the collective efforts of each of its individual members.

Unlike bumblebees, however, Docker containers don’t have pheromones that help them coordinate with one another instinctively. They don’t automatically know how to pool their resources in a way that most efficiently meets the needs of the colony (data center). Instead, containers on their own are designed to operate independently.

So, how do you make containers work together effectively, even when you’re dealing with many thousands of them? That’s where Docker Swarm comes in.

Swarm is a cluster orchestration tool for Docker containers. It provides an easy way to configure and manage large numbers of containers across a cluster of servers by turning all of them into a virtual host. It’s the hive mind that lets your containers swarm like busy bees, as it were.

Why Use Swarm for Cluster Configuration?

There are lots of similar cluster orchestration tools beyond Swarm. Kubernetes and Mesos are among the most popular alternatives, but the full list of options is long.

Deciding which orchestrator is right for you is fodder for a different post. I won’t delve too deeply into that discussion here. But it’s worth briefly noting a couple of characteristics about Swarm.

First, know that Swarm happens to be Docker’s homegrown cluster orchestration platform. That means it’s as tightly integrated into the rest of the Docker ecosystem as it can be. If you like consistency, and you have built the rest of your container infrastructure with Docker components, Swarm is probably a good choice for you.

Docker also recently published data claiming that Swarm outperforms Kubernetes. Arguably, the results in that study do not necessarily apply to all real-world data centers. (For a critique of Docker’s performance claims by Kelsey Hightower, an employee of the company — Google — where Kubernetes has its roots, click here.) But if your data center is similar in scale to the one used in the benchmarks, you might find that Swarm performs well for you, too.

Setting Up a Docker Swarm Cluster

Configuring Swarm to manage a cluster involves a little bit of technical know-how. But as long as you have some basic familiarity with the Docker CLI interface and Unix command-line tools, it’s nothing you can’t handle.

Here’s a rundown of the basic steps for setting up a Swarm cluster:

Step 0. Set up hosts. This is more a prerequisite than an actual step. (That’s why I labeled it step 0!) You can’t orchestrate a cluster till you have a cluster to orchestrate. So before all else, create your Docker images — including both the production containers that comprise your cluster and at least one image that you’ll use to host Swarm and related services.

You should also make sure your networking is configured to allow SSH connections to your Swarm image(s), since I’ll use this later on to access them.

Step 1. Install Docker Engine. Docker Engine is a Docker component that lets images communicate with Swarm via a CLI or API. If it’s not already installed on your images, install it with:

curl -sSL https://get.docker.com/ | sh

Then start Engine to listen for Swarm connections on port 2375 with a command like this:

sudo docker daemon -H tcp://0.0.0.0:2375 -H unix:///var/run/docker.sock

Step 2. Create a discovery backend. Next, I need to launch a Docker daemon that Swarm can use to find and authenticate different images that are part of the cluster.

To do this, SSH into an image that you want to use to host the discovery backend. Then run this command:

docker run -d -p 8500:8500 --name=consul progrium/consul -server -bootstrap

This will fire up the discovery backend on port 8500 on the image.

Step 3. Start Swarm. With that out of the way, the last big step is to start the Swarm instance. For this, SSH into the image you want to use to host Swarm. Then run:

docker run -d -p 4000:4000 swarm manage -H :4000 --replication --advertise :4000 consul://

Fill in the and fields in the command above with the IP addresses of the images you used in steps 1 and 2 for setting up Engine and the discovery backend, respectively. (It’s fine if you do all these using the same server, but you can use different ones if you like.)

Step 4. Connect to Swarm. The final step is to connect your client images to Swarm. You do that with a command like this:

docker run -d swarm join --advertise=:2375 consul://:8500

is the IP address of the image, and is the IP from steps 2 and 3 above.

Using Swarm: Commands

The hard part’s done! Once Swarm is set up as per the instructions above, using it to manage clusters is easy. Just run the docker command with the -H flag and the Swarm port number to monitor and control your Swarm instance.

For example, this command would give information about your cluster if it is configured to listen on port 4000:

docker -H :4000 info

You can also use a command like this to start an app on your cluster directly from Swarm, which will automatically decide how best to deploy it based on real-time cluster metrics:

docker -H :4000 run some-app

Getting the Most out of Swarm

Here are some quick pointers for getting the best performance out of Swarm at massive scale:

  • Consider creating multiple Swarm managers and nodes to increase reliability.
  • Make sure your discovery backend is running on a highly available image, since it needs to be up for Swarm to work.
  • Lock down networking so that connections are allowed only for the ports and services (namely, SSH, HTTP and the Swarm services themselves) that you need. This will increase security.
  • If you have a lot of nodes to manage, you can use a more sophisticated method for allowing Swarm to discover them. Docker explains that in detail here.

If you’re really into Swarm, you might also want to have a look at the Swarm API documentation. The API is a great resource if you need to build custom container-based apps that integrate seamlessly with the rest of your cluster (and that don’t already have seamless integration built-in, like the Sumo Logic log collector does).

How to Configure a Docker Cluster Using Swarm is published by the Sumo Logic DevOps Community. If you’d like to learn more or contribute, visit devops.sumologic.com. Also, be sure to check out Sumo Logic Developers for free tools and code that will enable you to monitor and troubleshoot applications from code to production.

About the Author

Hemant Jain is the founder and owner of Rapidera Technologies, a full service software development shop. He and his team focus a lot on modern software delivery techniques and tools. Prior to Rapidera he managed large scale enterprise development projects at Autodesk and Deloitte.

Data Analytics and Microsoft Azure

$
0
0

Microsoft Azure is the software giant’s offering for modern cloud applications

Today plenty of businesses still have real concerns about migrating applications to the cloud. Fears about network security, availability, and potential downtime swirl through the heads of chief decision makers, sometimes paralyzing organizations into standing pat on existing tech–even though it’s aging by the minute.

Enter Microsoft Azure, the industry leader’s solution for going to a partially or totally cloud-based architecture. Below is a detailed look at what Azure is, the power of partnering with Microsoft for a cloud or hybrid cloud solution, and the best way to get full and actionable visibility into your aggregated logs and infrastructure metrics so your organization can react quickly to opportunities.

What is Microsoft Azure?

Microsoft has leveraged its constantly-expanding worldwide network of data centers to create Azure, a cloud platform for building, deploying, and managing services and applications, anywhere. Azure lets you add cloud capabilities to your existing network through its platform as a service (PaaS) model, or entrust Microsoft with all of your computing and network needs with Infrastructure as a Service (IaaS). Either option provides secure, reliable access to your cloud hosted data–one built on Microsoft’s proven architecture.

Azure provides an ever expanding array of products and services designed to meet all your needs through one convenient, easy to manage platform. Below are just some of the capabilities Microsoft offers through Azure and tips for determining if the Microsoft cloud is the right choice for your organization.

What can Microsoft Azure Do?

Azure Logging

Microsoft maintains a growing directory of Azure services, with more being added all the time. All the elements necessary to build a virtual network and deliver services or applications to a global audience are available, including:

  • Virtual machines. Create Microsoft or Linux virtual machines (VMs) in just minutes from a wide selection of marketplace templates or from your own custom machine images. These cloud-based VMs will host your apps and services as if they resided in your own data center.
  • SQL databases. Azure offers managed SQL relational databases, from one to an unlimited number, as a service. This saves you overhead and expenses on hardware, software, and the need for in-house expertise.
  • Azure Active Directory Domain services. Built on the same proven technology as Windows Active Directory, this service for Azure lets you remotely manage group policy, authentication, and everything else. This makes moving and existing security structure partially or totally to the cloud as easy as a few clicks.
  • Application services. With Azure it’s easier than ever to create and globally deploy applications that are compatible on all popular web and portable platforms. Reliable, scalable cloud access lets you respond quickly to your business’s ebb and flow, saving time and money. With the introduction of Azure WebApps to the Azure Marketplace, it’s easier than ever to manage production, testing and deployment of web applications that scale as quickly as your business. Prebuilt APIs for popular cloud services like Office 365, Salesforce and more greatly accelerate development.
  • Visual Studio team services. An add-on service available under Azure, Visual Studio team services offer a complete application lifecycle management (ALM) solution in the Microsoft cloud. Developers can share and track code changes, perform load testing, and deliver applications to production while collaborating in Azure from all over the world. Visual Studio team services simplify development and delivery for large companies or new ones building a service portfolio.
  • Storage. Count on Microsoft’s global infrastructure to provide safe, highly accessible data storage. With massive scalability and an intelligent pricing structure that lets you store infrequently accessed data at a huge savings, building a safe and cost-effective storage plan is simple in Microsoft Azure.

Microsoft continues to expand its offerings in the Azure environment, making it easy to make a la carte choices for the best applications and services for your needs.

Why are people trusting their workloads to Microsoft Azure?

Two-thirds of Fortune 500 companies trust Microsoft Azure platform for their critical workloads.

It’s been said that the on-premise data center has no future. Like mainframes and dial-up modems before them, self-hosted data centers are becoming obsolete, being replaced by increasingly available and affordable cloud solutions.

Several important players have emerged in the cloud service sphere, including Amazon Web Services (AWS), perennial computing giant IBM, and Apple’s ubiquitous iCloud, which holds the picture memories and song preferences of hundreds of millions of smartphone users, among other data. With so many options, why are companies like 3M, BMW, and GE moving workloads to Microsoft Azure? Just some of the reasons:

  • Flexibility. With Microsoft Azure you can spin up new services and geometrically scale your data storage capabilities on the fly. Compare this to a static data center, which would require new hardware and OS purchasing, provisioning, and deployment before additional power could be brought to bear against your IT challenges. This modern flexibility makes Azure a tempting solution for organizations of any size.
  • Cost. Azure solutions don’t just make it faster and easier to add and scale infrastructure, they make it cheaper. Physical services and infrastructure devices like routers, load balancers and more quickly add up to thousands or even hundreds of thousands of dollars. Then there’s the IT expertise required to run this equipment, which amounts to major payroll overhead. By leveraging Microsoft’s massive infrastructure and expertise, Azure can trim our annual IT budget by head-turning percentages.
  • Applications. With a la carte service offerings like Visual Studio Team Services, Visual Studio Application Insights, and Azure’s scalable, on-demand storage for both frequently accessed and ‘cold’ data, Microsoft makes developing and testing mission-critical apps a snap. Move an application from test to production mode on the fly across a globally distributed network. Microsoft also offers substantial licensing discounts for migrating their existing apps to Azure, which represents even more opportunity for savings.
  • Disaster recovery. Sometimes the unthinkable becomes the very immediate reality. Another advantage of Microsoft Azure lay in its high-speed and geographically decentralized infrastructure, which creates limitless options for disaster recovery plans. Ensure that your critical application and data can run from redundant sites during recovery periods that last minutes or hours instead of days. Lost time is lost business, and with Azure you can guarantee continuous service delivery even when disaster strikes.

The combination of Microsoft’s vast infrastructure, constant application and services development, and powerful presence in the global IT marketplace has made Microsoft Azure solutions the choice of two-thirds of the world’s Fortune 500 companies. But the infinite scalability of Azure can make it just as right for your small personal business.

Logging capabilities within Microsoft Azure

There’s gold in those logs. Microsoft Azure offers logging and metrics that can help you improve performance.

The secret gold mine of any infrastructure and service solution is ongoing operational and security visibility, and ultimately these comes down to extracting critical log and infrastructure metrics from the application and underlying stack. The lack of this visibility is like flying a plane blind—no one does it. Azure comes with integrated health monitoring and alert capabilities so you can know in an instant if performance issues or outages are impacting your business. Set smart alert levels for events from:

  • Azure diagnostic infrastructure logs. Get current insights into how your cloud network is performing and take action to resolve slow downs, bottlenecks, or service failures.
  • Windows IIS logs. View activity on your virtual web servers and respond to traffic patterns or log-in anomalies with the data Azure gathers on IIS 7.
  • Crash dumps. Even virtual machines can ‘blue screen’ and other virtual equipment crashes can majorly disrupt your operations. With Microsoft Azure you can record crash dump data and troubleshoot to avoid repeat problems.
  • Custom error logs. Set Azure alerts to inform you about defined error events. This is especially helpful when hosting private applications that generate internal intelligence about operations, so you can add these errors to the health checklist Azure maintains about your network.

Microsoft Azure gives you the basic tools you need for error logging and monitoring, diagnostics, and troubleshooting to ensure continuous service delivery in your Azure cloud environment.

Gain Full Visibility into Azure with Unified Logs and Metrics

Sumo Logic brings unparalleled visualizations and actionable insights to your Microsoft Azure infrastructure so you can see and respond to changes in real-time. Even with Azure’s native logging and analytics tools, the vast amount of data flowing to make your network and applications operate can be overwhelming. The volume, variety and velocity of cloud data should not be underestimated. With the help of Sumo Logic, a trusted Microsoft partner, managment of that data is simple.

The Sumo Logic platform unifies logs and metrics from the structured, semi-structured, and unstructured data across your entire Microsoft environment. Machine learning algorithms process vast amounts of log and metrics data, looking for anomalies and deviations from normal patterns of activity, alerting you when appropriate. With Log Reduce, Log Compare and Outlier Detection, extract continuous intelligence from your application stack and proactively respond to operational and security issues.

The Sumo Logic apps for Microsoft Azure Audit, Microsoft Azure Web Apps, Microsoft Windows Server Active Directory, Microsoft Internet Information Services (IIS), and the popular Windows Performance app,  make ingesting machine data in real-time and rendering it into clear, interactive visualizations for a complete picture of your applications and data.

Sumo Logic provides real-time data and full visibility

Before long the on-premise data center—along with its expensive hardware and hordes of local technicians on the payroll—may be lost to technology’s graveyard. But smart, researched investment into cloud capabilities like those provided in Microsoft Azure will make facing tomorrow’s bold technology challenges and possibilities relatively painless.

Optimizing AWS Lambda Cost and Performance Through Monitoring

$
0
0

AWS_Lambda_Sumo_Logic_FunctionIn this post, I’ll be discussing the use of monitoring as a tool to optimize the cost and performance of AWS Lambda. I’ve worked on a number of teams, and almost without exception, the need to put monitoring in place has featured prominently in early plans. Tickets are usually created and discussed, and then placed in the backlog, where they seem to enter a cycle of being important—but never quite enough to be placed ahead of the next phase of work.

In reality, especially in a continuous development environment, monitoring should be a top priority, and with the tools available in AWS and organizations like Sumo Logic, setting up basic monitoring shouldn’t take more than a couple of hours, or a day at most.

What exactly is AWS Lambda?

AWS Lambda from Amazon Web Services (AWS) allows an organization to introduce functionality into the AWS ecosystem without the need to provision and maintain servers. A Lambda function can be uploaded and configured, and then can be executed as frequently as needed without further intervention.

Contrary to a typical server environment, you don’t have any control, nor do you require insight into the data elements like CPU usage or available memory, and you don’t have to worry about scaling your functionality to meet increased demand. Once a Lambda has been deployed, the cost is based on the number of requests and a few key elements we’ll discuss shortly.

How to setup AWS Lambda monitoring, and what to track

Before we get into how to set up monitoring and what data elements should be tracked, it is vital that you put an effective monitoring system in place. And with that decision made, AWS helps you right from the start. Monitoring is handled automatically by AWS Lambda, which means less time configuring and more time analyzing results. Logs are automatically sent to Amazon Cloudwatch where a user can view basic metrics, or harness the power of an external reporting system, and gain key insights into how Lambda is performing. The Sumo Logic App for AWS Lambda uses the Lambda logs via CloudWatch and visualizes operational and performance trends about all the Lambda functions in your account, providing insight into executions such as memory and duration usage, broken down by function versions or aliases.

The pricing model for functionality deployed using AWS Lambda is calculated by the number of requests received, and the time and resources needed to process the request. Therefore, the key metrics that need to be considered are:

  • Number of requests and associated error counts.
  • Resources required for execution.
  • Time required for execution or latency.
  • Request and error counts in Lambda

The cost per request is the simplest of the three factors. In the typical business environment, the goal is to drive traffic to the business’ offerings; thus, increasing the number of requests is key. Monitoring of these metrics should compare the number of actual visitors with the number of requests being made to the function. Depending on the function and how often a user is expected to interact with it, you can quickly determine what an acceptable ratio might be—1:1 or 1:3. Variances from this should be investigated to determine what the cause might be.

Lambda Resources usage and processing time

When Lambda is first configured, you can specify the expected memory usage of the function. The actual runtime usage may differ, and is reported on a per-request basis. Amazon then factors the cost of the request based on how much memory is used, and for how long. The latency is based on 100ms segments.

If, for example, you find that your function typically completes in a time between 290ms and 310ms, there would be a definite cost savings if the function could be optimized to perform consistently in less than 300ms. These optimizations, however, would need to be analyzed to determine whether they increase resource usage for that same time, and if that increase in performance is worth an increase in cost.

For more information on how Amazon calculates costs relative to resource usage and execution time, you can visit the AWS Lambda pricing page.

AWS Lambda: The big picture

Finally, when implementing and considering metrics, it is important to consider the big picture. One of my very first attempts with a Lambda function yielded exceptional numbers with respect to performance and utilization of resources. The process was blazingly fast, and barely used any resources at all. It wasn’t until I looked at the request and error metrics that I realized that over 90% of my requests were being rejected immediately.

While monitoring can’t make your business decisions for you, having a solid monitoring system in place will give an objective view of how your functions are performing, and data to support the decisions you need to make for your business.

About the Author

Mike Mackrory is a Global citizen who has settled down in the Pacific Northwest – for now. By day he works as a Senior Engineer on a Quality Engineering team and by night he writes, consults on several web based projects and runs a marginally successful eBay sticker business. When he’s not tapping on the keys, he can be found hiking, fishing and exploring both the urban and the rural landscape with his kids. Always happy to help out another developer, he has a definite preference for helping those who bring gifts of gourmet donuts, craft beer and/or Single-malt Scotch.


Using Logs to Speed Your DevOps Workflow

$
0
0

Using Logs to Speed Your DevOps Workflow - Sumo LogicLog aggregation and analytics may not be a central part of the DevOps conversation. But effective use of logs is key to leveraging the benefits associated with the DevOps movement and the implementation of continuous delivery.

Why is this the case? How can organizations take advantage of logging to help drive their DevOps workflow? Keep reading for a discussion of how logging and DevOps fit together.

Defining DevOps

If you are familiar with DevOps, you know that it’s a new (well, new as of the past five years or so) philosophy of software development and delivery. It prioritizes the following goals:

  • Constant communication. DevOps advocates the removal of “silos” between different teams. That way, everyone involved in development and delivery, from programmers to QA folks to production-environment admins, can collaborate readily and remain constantly aware of the state of development.
  • Continuous integration and delivery. Rather than making updates to code incrementally, DevOps prioritizes a continuous workflow. Code is updated continuously, the updates are tested continuously, and validated code is delivered to users continuously.
  • Flexibility. DevOps encourages organizations to use whichever tool is the best for solving a particular challenge, and to update tool sets regularly as new solutions emerge. Organizations should not wed themselves to a particular framework.
  • Efficient testing. Rather than waiting until code is near production to test it, DevOps prioritizes testing early in the development cycle. (This strategy is sometimes called “shift-left” testing.) This practice assures that problems are discovered when the time required to fix them is minimal, rather than waiting until they require a great deal of back peddling.

DevOps and Logging

None of the goals outlined above deal with logging specifically. And indeed, because DevOps is all about real-time workflows and continuous delivery, it can be easy to ignore logging entirely when you’re trying to migrate to a DevOps-oriented development strategy.

Yet logs are, in fact, a crucial part of an efficient DevOps workflow. Log collection and analysis help organizations to optimize their DevOps practices in a number of ways.

Consider how log aggregation impacts the following areas.

Communication and Workflows in DevOps

Implementing effective communication across your team is about more than simply breaking down silos and ensuring that everyone has real-time communication tools available. Logs also facilitate efficient communication. They do this in two ways.

First, they maximize visibility into the development process for all members of the team. By aggregating logs from across the delivery pipeline—from code commits to testing logs to production server logs—log analytics platforms assure that everyone can quickly locate and analyze information related to any part of the development cycle. That’s crucial if you want your team members to be able to remain up to speed with the state of development.

Second, log analytics help different members of the organization understand one another. Your QA team is likely to have only a basic ability to interpret raw code commits. Your programmers are not specialists in reading test results. Your admins, who deploy software into production, are experts in only that part of the delivery pipeline.

Log analytics, however, can be used to help any member of the team interpret data associated with any part of the development process. Rather than having to understand raw data from a part of the workflow with which they are not familiar, team members can rely on analytics results to learn what they need quickly.

Continuous visibility

To achieve continuous delivery, you need to have continuous visibility into your development pipeline. In other words, you have to know, on a constant, ongoing basis, what is happening with your code. Otherwise, you’re integrating in the dark.

Log aggregation and analytics help deliver continuous visibility. They provide a rich source of information about your pipeline at all stages of development. If you want to know the current quality and stability of your code, for example, you can quickly pull analytics from testing logs to find that information. If you want to know how your app is performing in production, you can do the same with server logs.

Flexibility from log analytics

In order to switch between development frameworks and programming languages at will, you have to ensure that moving between platforms requires as little change as possible to your overall workflow. Without log aggregation, however, you’ll have to overhaul the way you store and analyze logs every time you add or subtract a tool from your pipeline.

A better approach is to use a log aggregation and analytics platform like Sumo Logic. By supporting a wide variety of logging configurations, Sumo Logic assures that you can modify your development environment as needed, while keeping your logging solution constant.

Faster testing through log analytics

Performing tests earlier in the development cycle leads to faster, more efficient delivery only if you are able to fix the problems discovered by tests quickly. Otherwise, the bugs that your tests reveal will hold up your workflow, no matter how early the bugs are found.

Log analytics are a helpful tool for getting to the bottom of bugs. By aggregating and analyzing logs from across your pipeline, you can quickly get to the source of a problem with your code. Logs help keep the continuous delivery pipeline flowing smoothly, and maximize the value of shift-left testing.

Moving Towards a DevOps Workflow

Log aggregation and analytics may not be the first things that come to mind when you think of DevOps. But effective collection and interpretation of log data is a crucial part of achieving a DevOps-inspired workflow.

Logging on its own won’t get you to continuous delivery, of course. That requires many other ingredients, too. But it will get you closer if you’re not already there. And if you are currently delivering continuously, effective logging can help to make your pipeline even faster and more efficient.

Using Logs to Speed Your DevOps Workflow API Workflows is published by the Sumo Logic DevOps Community. If you’d like to learn more or contribute, visit devops.sumologic.com. Also, be sure to check out Sumo Logic Developers for free tools and code that will enable you to monitor and troubleshoot applications from code to production.

About the Author

Chris Tozzi has worked as a journalist and Linux systems administrator. He has particular interests in open source, agile infrastructure and networking. He is Senior Editor of content and a DevOps Analyst at Fixate IO.

Integrate Azure Function with Sumo Logic Schedule Search

$
0
0

Azure Functions

Azure Azure Functionsfunctions are event driven pieces of code that can used to integrate systems, build APIs, process data and trigger any action/reaction to events without having to worry about infrastructure to run it.
More info on Azure functions can be found here.


Sumo Logic Scheduled Search

Scheduled searches are standard saved searches that are executed on a schedule you set. Once configured, scheduled searches run continuously, making them a great tool for continuously monitoring your stack, infrastructure, process, build environment, etc.

Why integrate Sumo Logic Scheduled Search with Azure Function?

Answer is very simple: Using Sumo Logic’s machine learning algorithm and search capabilities, you can Monitor and alert on key metrics and KPIs in real time to rapidly identify problems, detect outliers, abnormal behavior using dynamic thresholds or any other event which is important for you. Once you have detected the event for your use case, you can have the Azure function respond to your event and take an appropriate action.

More info on real time monitoring using Sumo Logic can be found here.

Three Steps guide to Integrate Azure Function with Sumo Logic Schedule Search.

Case in point: Web app scheduled search detects an outage -> Sumo Logic triggers Azure Function via Webhook Connection –> Azure function gets executed, and takes preventive/corrective action.

Step 1: Create Azure Function and write the preventive/corrective action you want to take.

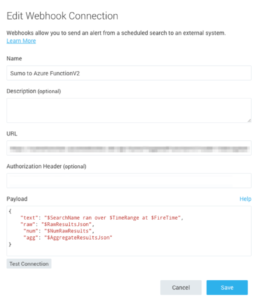
1Step 2: Set up Sumo Logic Webhook Connection which will trigger Azure Function created in #1. To set up connection, follow the steps under ‘Setting up Webhook Connections

2

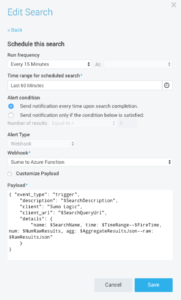
Step 3: Create a Schedule Search that will monitor your infrastructure for any outage, call the Webhook connection created in #2.

3

Example

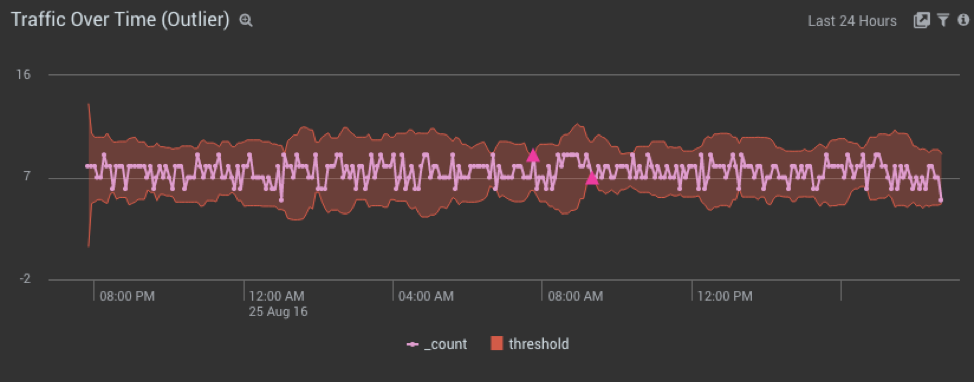
Sumo Logic with it’s machine learning capabilities can detect an outlier in incoming traffic. Given a series of time-stamped numerical values, using the Sumo Logic’s Outlier operator in a query can identify values in a sequence that seem unexpected, and would identify an alert or violation, for example, for a scheduled search. To do this, the Outlier operator tracks the moving average and standard deviation of the value, and detects or alerts when the difference between the value exceeds mean by some multiple of standard deviation, for example, 3 standard deviation.

In this example, we want to trigger an Azure Function whenever there is an outlier in incoming traffic for Azure Web Apps.

4


Step 1: Create an Azure function – for this example I have following Node.js function

#r "Newtonsoft.Json"
using System;
using System.Net;
using Newtonsoft.Json;

public static async Task<object> Run(HttpRequestMessage req, TraceWriter log)
{
    log.Info($"Webhook was triggered Version 2.0!");
    string jsonContent = await req.Content.ReadAsStringAsync();
    dynamic data = JsonConvert.DeserializeObject(jsonContent);
    log.Info($"Webhook was triggered - TEXT: {data.text}!");
    log.Info($"Webhook was triggered - RAW : {data.raw} !");
    log.Info($"Webhook was triggered - NUM : {data.num} !");
    log.Info($"Webhook was triggered - AGG : {data.agg}!");
   /* Add More Logic to handle an outage */
    return req.CreateResponse(HttpStatusCode.OK, new {
        greeting = $"Hello"
    });
}

Copy and paste Function Url in a separate notepad, you will need this in Step 2

Step 2: Create Sumo Logic Webhook Connection.

From your Sumo Logic account: Go to Manage -> Connections, Click Add and then click Webhook.

        1. Provide appropriate name and Description.
        2. Copy paste the Azure Function Url (from step #1) in URL field.
        3. For Payload, add following JSON.
        4. Test connection, and Save it.
{
    "text": "$SearchName ran over $TimeRange at $FireTime",
    "raw": "$RawResultsJson",
     "num": "$NumRawResults",
     "agg": "$AggregateResultsJson"
}

Step 3: Create a Schedule Search.

Scheduled searches are saved searches that run automatically at specified intervals. When a scheduled search is configured to send an alert, it can be sent to another tool via a Webhook Connection.

From your Sumo Logic account, copy paste following search and click Save As

_sourceCategory=Azure/webapp
| parse regex "\d+-\d+-\d+ \d+:\d+:\d+ (?<s_sitename>\S+) (?<cs_method>\S+) (?<cs_uri_stem>\S+) (?<cs_uri_query>\S+) (?<src_port>\S+) (?<src_user>\S+) (?<client_ip>\S+) (?<cs_user_agent>\S+) (?<cs_cookie>\S+) (?<cs_referrer>\S+) (?<cs_host>\S+) (?<sc_status>\S+) (?<sc_substatus>\S+) (?<sc_win32_status>\S+) (?<sc_bytes>\S+) (?<cs_bytes>\S+) (?<time_taken>\S+)"
| timeslice 5m
| count by _timeslice
| outlier _count
| where _count_violation=1

Note: This assumes you have _sourceCategory set up with Azure/webapp. If you don’t have this source set up, then you can use your own search to schedule it.

5

  • In the Save Search As dialog, enter a name for the search and an optional description.
  • Click Schedule this search.
  • Choose 60 Minutes for Run Frequency
  • Last 60 Minutes for Time range for scheduled search
  • For Alert condition, choose Send notification only if the condition below is satisfied
  • Number of results Greater than > 0
  • For Alert Type choose Webhook
  • For Webhook, choose the Webhook connection you created in Step 2 from dropdown.
  • Click Save

Depending upon Run Frequency of your scheduled search, you can check the logs of your Azure function from portal to confirm it got triggered.

2016-08-25T20:50:36.349 Webhook was triggered Version 2.0!
2016-08-25T20:50:36.349 Webhook was triggered - TEXT: Malicious  Client ran over 2016-08-25 19:45:00 UTC - 2016-08-25 20:45:00 UTC at 2016-08-25 20:45:00 UTC!
2016-08-25T20:50:36.349 Webhook was triggered - RAW :  !
2016-08-25T20:50:36.349 Webhook was triggered - NUM : 90 !
2016-08-25T20:50:36.351 Webhook was triggered - AGG : [{"Approxcount":13,"client_ip":"60.4.192.44"},{"Approxcount":9,"client_ip":"125.34.187"},{"Approxcount":6,"client_ip":"62.64.0.1"},{"Approxcount":6,"client_ip":"125.34.14"}]!
2016-08-25T20:50:36.351 Function completed (Success, Id=72f78e55-7d12-49a9-aa94-8bb347f72672)
2016-08-25T20:52:25  No new trace in the past 1 min(s).
2016-08-25T20:52:49.248 Function started (Id=d22f92cf-0cf7-4ab2-ad0e-fa2f23e25e09)
2016-08-25T20:52:49.248 Webhook was triggered Version 2.0!
2016-08-25T20:52:49.248 Webhook was triggered - TEXT: Errors Last Hour ran over 2016-08-25 19:45:00 UTC - 2016-08-25 20:45:00 UTC at 2016-08-25 20:45:00 UTC!
2016-08-25T20:52:49.248 Webhook was triggered - RAW :  !
2016-08-25T20:52:49.248 Webhook was triggered - NUM : 90 !
2016-08-25T20:52:49.248 Webhook was triggered - AGG : [{"server_errors":39.0}]!
2016-08-25T20:52:49.248 Function completed (Success, Id=d22f92cf-0cf7-4ab2-ad0e-fa2f23e25e09)

Summary

We created a scheduled search which runs every 60 minutes, to find an outlier in last 60 minutes of incoming traffic data. If there is an outlier, webhook connection gets activated and triggers Azure function.

More Reading

Building Great Alerts

  • Actionable – there should be a playbook for every alert received
  • Directed – there should be an owner to follow the playbook
  • Dynamic – Static thresholds can have “false positives”

Customers Share their AWS Logging with Sumo Logic Use Cases

$
0
0

In June Sumo Dojo (our online community) launched a contest to learn more about how our customers are using Amazon Web Services like EC2, S3, ELB, and AWS Lambda. The Sumo Logic service is built on AWS and we have deep integration into Amazon Web Services. And as an AWS Technology Partner we’ve collaborated closely with AWS to build apps like the Sumo Logic App for Lambda.

So we wanted to see how our customers are using Sumo Logic to do things like collecting logs from CloudWatch to gain visibility into their AWS applications. We thought you’d be interested in hearing how others are using AWS and Sumo Logic, too. So in this post I’ll share their stories along with announcing the contest winner.

The contest narrowed down to two finalists – SmartThings, which is a Samsung company operates in the home automation industry and provides access to a wide range of connected devices to create smarter homes that enhance the comfort, convenience, security and energy management for the consumer.

WHOmentors, Inc. our second finalist, is a publicly supported scientific, educational and charitable corporation, and fiscal sponsor of Teen Hackathon. The organization is, according to their site, “primarily engaged in interdisciplinary applied research to gain knowledge or understanding to determine the means by which a specific, recognized need may be met.”

At stake was a DJI Phantom 3 Drone. All entrants were awarded a $10 Amazon gift card.

dji_phantom3_drone - sumo logic contest aws logging

AWS Logging Contest Rules

The Drone winner was selected based on the following criteria:

  • You have to be a user of Sumo Logic and AWS
  • To enter the contest, a comment had to be placed on this thread in Sumo Dojo.
  • The post could not be anonymous – you were required to log in to post and enter.
  • Submissions closed August 15th.

As noted in the Sumo Dojo posting, the winner would be selected based on our own editorial judgment and community reactions to the post (in the form of comments or “likes”) to select one that’s most interesting, useful and detailed.

SmartThings

SmartThings has been working on a feature to enable Over-the-air programming (OTA) firmware updates of Zigbee Devices on user’s home networks. For the uninitiated, Zigbee is an IEEE specification for a suite of high-level communication protocols used to create personal area networks with small, low-power digital radios. See the Zigbee Alliance for more information.

According to one of the firmware engineers at SmartThings, there are a lot of edge cases and potential points of failure for an OTA update including:

  • The Cloud Platform
  • An end user’s hub
  • The device itself
  • Power failures
  • RF inteference on the mesh network

Disaster in this scenario would be a user’s device ending up in a broken state. As Vlad Shtibin related:

“Our platform is deployed across multiple geographical regions, which are hosted on AWS. Within each region we support multiple shards, furthermore within each shard we run multiple application clusters. The bulk of the services involved in the firmware update are JVM based application servers that run on AWS EC2 instances.

Our goal for monitoring was to be able to identify as many of these failure points as possible and implement a recovery strategy. Identifying these points is where Sumo Logic comes into the picture. We use a key-value logger with a specific key/value for each of these failure points as well as a correlation ID for each point of the flow. Using Sumo Logic, we are able to aggregate all of these logs by passing the correlation ID when we make calls between the systems.

Using Sumo Logic, we are able to aggregate all of these logs by passing the correlation ID when we make calls between the systems.

We then created a search query (eventually a dashboard) to view the flow of the firmware updates as they went from our cloud down to the device and back up to the cloud to acknowledge that the firmware was updated. This query parses the log messages to retrieve the correlation ID, hub, device, status, firmware versions, etc.. These values are then fed into a Sumo Logic transaction enabling us to easily view the state of a firmware update for any user in the system at a micro level and the overall health of all OTA updates on the macro level.

Depending on which part of the infrastructure the OTA update failed, engineers are then able to dig in deeper into the specific EC2 instance that had a problem. Because our application servers produce logs at the WARN and ERROR level we can see if the update failed because of a timeout from the AWS ElasticCache service, or from a problem with a query on AWS RDS. Having quick access to logs across the cluster enables us to identify issues across our platform regardless of which AWS service we are using.

As Vlad noted, This feature is still being tested and hasn’t been rolled out fully in PROD yet. “The big take away is that we are much more confident in our ability identify updates, triage them when they fail and ensure that the feature is working correctly because of Sumo Logic.”

WHOmentors.com

WHOmentors.com, Inc. is a nonprofit scientific research organization and the 501(c)(3) fiscal sponsor of Teen Hackathon. To facilitate their training to learn languages like Java, Python, and Node.js, each individual participate begins with the Alexa Skills Kit, a collection of self-service application program interfaces (APIs), tools, documentation and code samples that make it fast and easy for teens to add capabilities for use Alexa-enabled products such as the Echo, Tap, or Dot.

According WHOmentors.com CEO, Rauhmel Fox, “The easiest way to build the cloud-based service for a custom Alexa skill is by using AWS Lambda, an AWS offering that runs inline or uploaded code only when it’s needed and scales automatically, so there is no need to provision or continuously run servers.

With AWS Lambda, WHOmentors.com pays only for what it uses. The corporate account is charged based on the number of requests for created functions and the time the code executes. While the AWS Lambda free tier includes one million free requests per month and 400,000 gigabyte (GB)-seconds of compute time per month, it becomes a concern when the students create complex applications that tie Lambda to other expensive services or the size of their Lambda programs are too long.

Ordinarily, someone would be assigned to use Amazon CloudWatch to monitor and troubleshoot the serverless system architecture and multiple applications using existing AWS system, application, and custom log files. Unfortunately, there isn’t a central dashboard to monitor all created Lambda functions.

With the integration of a single Sumo Logic collector, WHOmentors.com can automatically route all Amazon CloudWatch logs to the Sumo Logic service for advanced analytics and real-time visualization using the Sumo Logic Lambda functions on Github.”

Using the Sumo Logic Lambda Functions

“Instead of a “pull data” model, the “Sumo Logic Lambda function” grabs files and sends them to Sumo Logic web application immediately. Their online log analysis tool offers reporting, dashboards, and alerting as well as the ability to run specific advanced queries as needed.

The real-time log analysis combination of the “SumoLogic Lambda function” assists me to quickly catch and troubleshoot performance issues such as the request rate of concurrent executions that are either stream-based event sources, or event sources that aren’t stream-based, rather than having to wait hours to identify whether there was an issue.

I am most concerned about AWS Lambda limits (i.e., code storage) that are fixed and cannot be changed at this time. By default, AWS Lambda limits the total concurrent executions across all functions within a given region to 100. Why? The default limit is a safety limit that protects the corporate from costs due to potential runaway or recursive functions during initial development and testing.

As a result, I can quickly determine the performance of any Lambda function and clean up the corporate account by removing Lambda functions that are no longer used or figure out how to reduce the code size of the Lambda functions that should not be removed such as apps in production.”

The biggest relief for Rauhmel is he is able to encourage the trainees to focus on coding their applications instead of pressuring them to worry about the logs associated with the Lambda functions they create.

And the Winner of AWS Logging Contest is…

Just as at the end of an epic World-Series battle between two MLB teams, you sometimes wish both could be declared winner. Alas, there can only be one. We looked closely at the use cases, which were very different from one another. Weighing factors like the breadth in the usage of the Sumo Logic and AWS platforms added to our drama. While SmartThings uses Sumo Logic broadly to troubleshoot and prevent failure points, WHOmentors.com use case is specific to AWS Lambda. But we couldn’t ignore the cause of helping teens learn to write code in popular programming languages, and building skills that may one day lead them to a job.

Congratulations to WHOmentors.com. Your Drone is on its way!

Using HTTP Request Builders to Create Repeatable API Workflows

$
0
0

paw http request builderAs an API Engineer, you’ve probably spent hours carefully considering how API will be consumed by client software, what data you are making available at which points within particular workflows, and strategies for handling errors that bubble up when a client insists on feeding garbage to your API. You’ve written tests for the serializers and expected API behaviors, and you even thought to mock those external integrations so you can dive right into the build. As you settle in for a productive afternoon of development, you notice a glaring legacy element in your otherwise modern development setup:

  • Latest and greatest version of your IDE: Check.
  • Updated compiler and toolchain: Installed.
  • Continuous Integration: Ready and waiting to put your code through its paces.
  • That random text file containing a bunch of clumsily ordered cURL commands.

…one of these things is not like the others.

It turns out we’ve evolved…and so have our API tools

Once upon a time, that little text file was state-of-the-art in API development. You could easily copy-paste commands into a terminal and watch your server code spring into action; however, deviating from previously built requests required careful editing. Invariably, a typo would creep into a crucial header declaration, or revisions to required parameters were inconsistently applied, or perhaps a change in HTTP method resulted in a subtly different API behavior that went unnoticed release over release.

HTTP Request Builders were developed to take the sting out of developing and testing HTTP endpoints by reducing the overhead in building and maintaining test harnesses, allowing you to get better code written with higher quality. Two of the leaders in the commercial space are Postman and Paw, and they provide a number of key features that will resonate with those who either create or consume APIs:

  • Create HTTP Requests in a visual editor: See the impact of your selected headers and request bodies on the request before you send it off to your server. Want to try an experiment? Toggle parameters on or off with ease or simply duplicate an existing request and try two different approaches!
  • Organize requests for your own workflow…or collaborate with others: Create folders, reorder, and reorganize requests to make it painless to walk through sequential API calls.
  • Test across multiple environments: Effortlessly switch between server environments or other variable data without having to rewrite every one of your requests.
  • Inject dynamic data: Run your APIs as you would expect them to run in production, taking data from a previous API as the input to another API.

From here, let’s explore the main features of HTTP Request Builders via Paw and show how those features can help make your development and test cycles more efficient. Although Paw will be featured in this post, many of these capabilities exist in other HTTP Builder packages such as Postman.

How to Streamline your HTTP Request Pipeline

Command-line interfaces are great for piping together functionality in one-off tests or when building out scripts for machines to follow, but quickly become unwieldy when you have a need to make sweeping changes to the structure or format of an API call. This is where visual editors shine, giving the human user an easily digestible view of the structure of the HTTP request, including its headers, querystring and body so that you can review and edit requests in a format that puts the human first. Paw’s editor is broken up into three areas. Working from left to right, these areas are:

  • Request List: Each distinct request in your Paw document gets a new row in this panel and represents the collection of request data and response history associated with that specific request.
  • HTTP Request Builder: This is the primary editor for constructing HTTP requests. Tabs within this panel allow you to quickly switch between editing headers, URL parameters, and request bodies. At the bottom of the panel is the code generator, allowing you to quickly spawn code for a variety of languages including Objective-C, Swift, Java, and even cURL!
  • HTTP Exchange: This panel reflects the most recent request and associated response objects returned by the remote server. This panel also offers navigation controls for viewing historical requests and responses.

Paw Document containing three sample HTTP Requests and the default panel arrangement

Figure 1. Paw Document containing three sample HTTP Requests and the default panel arrangement.

As you work through building up the requests that you use in your API workflows, you can easily duplicate, edit, and execute a request all in a matter of a few seconds. This allows you to easily experiment with alternate request formats or payloads while also retaining each of your previous versions. You might even score some brownie points with your QA team by providing a document with templated requests they can use to kick-start their testing of your new API!

Organize Request Lists for Yourself and Others

The Request List panel also doubles as the Paw document’s organization structure. As you add new requests, they will appear at the bottom of the list; however, you can customize the order by dragging and dropping requests, or a create folders to group related requests together. The order and names attached to each request help humans understand what the request does, but in no way impacts the actual requests made of the remote resource. Use these organization tools to make it easy for you to run through a series of tests or to show others exactly how to replicate a problem.

If the custom sort options don’t quite cover your needs, or if your document starts to become too large, Sort and Filter bars appear at the bottom of the Request List to help you focus only on the requests you are actively working with. Group by URL or use the text filter to find only those requests that contain the URL you are working with.

Request List panel showing saved requests, folder organization, and filtering options

Figure 2. Request List panel showing saved requests, folder organization, and filtering options.

Dealing with Environments and Variables

Of course, many times you want to be able to test out behaviors across different environments — perhaps your local development instance, or the development instance updated by the Continuous Integration service. Or perhaps you may even want to compare functionality to what is presently available in production.

It would be quite annoying to have to edit each of your requests and change the URL from one host to another. Instead, let Paw manage that with a quick switch in the UI.

Paw’s Environment Switcher changes variables with just a couple of clicks.

Figure 3. Paw’s Environment Switcher changes variables with just a couple of clicks.

The Manage Environments view allows you to create different “Domains” for related kinds of variables, and add “Environments” as necessary to handle permutations of these values:

Paw’s Environment Editor shows all Domains and gives easy access to each Environment.

Figure 4. Paw’s Environment Editor shows all Domains and gives easy access to each Environment.

This allows you flexibility in adjusting the structure of a payload with a few quick clicks instead of having to handcraft an entirely new request. The Code Generator pane at the bottom of the Request Builder pane updates to show you exactly how your payload changes:

Paw Document showing the rebuilt request based on the Server Domain’s Environment

Figure 5. Paw Document showing the rebuilt request based on the Server Domain’s Environment.

One of the most common setups is to have a Server Domain with Environments for the different deployed versions of code. From there, you could build out a variable for the Base URL, or split it into multiple variables so that the protocol could be changed, independent of the host address — perhaps in order to quickly test whether HTTP to HTTPS redirection still works after making changes to a load balancer or routing configuration. Paw’s variables can even peer into other requests and responses and automatically rewrite successive APIs.

Many APIs require some form of authentication to read or write privileged material. Perhaps the mechanism is something simple like a cookie or authentication header, or something more complex like an oAuth handshake. Either way, there is a bit of data in the response of one API that should be included in the request to a subsequent API. Paw variables can parse data from prior requests and prior responses, dynamically updating subsequent requests:

Paw Document revealing the Response Parsed Body Variable extracting data from one request and injecting it into another.

Figure 6. Paw Document revealing the Response Parsed Body Variable extracting data from one request and injecting it into another.

In the case shown above, we’ve set a “Response parsed body” variable as a Querystring parameter to a successive API, specifically grabbing the UserId key for the post at index 0 in the Top 100 Posts Request. Any indexable path in the response of a previous request is available in the editor. You may need to extract a session token from the sign-in API and apply it to subsequent authenticated-only requests. Setting this variable gives you the flexibility to change server environments or users, execute a sign-in API call, then proceed to hit protected endpoints in just a few moments rather than having to make sweeping edits to your requests.

Request Builders: Fast Feedback, Quick Test Cycles

HTTP Request Builders help give both API developers and API consumers a human-centric way of interacting with what is primarily a machine-to-machine interface. By making it easy to build and edit HTTP requests, and providing mechanisms to organize, sort, and filter requests, and allowing for fast or automatic substitution of request data, working with any API becomes much easier to digest. The next time someone hands you a bunch of cURL commands, take a few of those minutes you’ve saved from use of these tools, and help a developer join us here in the future!

Using HTTP Request Builders to Create Repeatable API Workflows is published by the Sumo Logic DevOps Community. If you’d like to learn more or contribute, visit devops.sumologic.com. Also, be sure to check out Sumo Logic Developers for free tools and code that will enable you to monitor and troubleshoot applications from code to production.

About the Author

Bryan Musial (@BKMu) is a Full-Stack Senior Software Engineer with the San Francisco-based startup, Tally (www.meettally.com), working to make managing your credit cards automatic, simple, and secure. Previously, Bryan worked for the Blackboard Mobile team where he built and shipped iOS and Android applications used by millions of students and teachers every day.

Integrated Container Security Monitoring with Twistlock

$
0
0

Twistlock provides dev-to-production security for the container environment. More specifically, The Twistlock container security suite offers 4 major areas of functionality:

  • Vulnerability management that inspects the full stack of components in a container image and allows you to eradicate vulnerabilities before deployment.
  • Compliance which enforces compliance with industry best practices and configuration policies, with 90+ built-in settings covering the entire CIS Docker benchmark.
  • Access control that applies granular policies to managing user access to Docker, Swarm, and Kubernetes APIs.  This capability builds on Twistlock’s authorization plugin framework that’s been shipping as a part of Docker itself since 1.10.
  • Runtime defense, which combines static analysis, machine learning, Twistlock Labs research, and active threat feeds to protect container environments at scale, without human intervention.

Integration with Sumo Logic

Because Twistlock has a rich set of data about the operations of a containerized environment, integrating with powerful operational analytics tools like Sumo Logic is a natural fit.  In addition to storing all event data in its own database, Twistlock also writes events out via standard syslog messages so it’s easy to harvest and analyze using tools like Sumo Logic.

Setting up integration is easy, simply follow the standard steps for collecting logs from a Linux host that Sumo Logic has already automated.  After a collector is installed on a host Twistlock is protecting, configure Sumo Logic to harvest the log files from /var/lib/twistlock/log/*.log:

3

In this case, the log collection is named “twistlock_logs” to make it easy to differentiate between standard Linux logs.

Note that Twistlock produces 2 main types of logs, aligned with our distributed architecture as illustrated below.

  • Console logs track centralized activities such as rule management, configuration changes, and overall system health.
  • Defender logs are produced on each node that Twistlock protects and are local in scope.  These logs track activities such as authentication to the local node and runtime events that occur on the node.

4_cloud

Once log files are collected, searching, slicing, and visualizing data is done using the standard Sumo Logic query language and tools.  Here’s a simple example of just looking across all Twistlock logs using thesource=”twistlock_logs” query:

5
Of course, the real power of a tool like Sumo Logic is being able to easily sort, filter, and drill down into log data.  So, let’s assume you want to drill down a little further and look for process violations that Twistlock detected on a specific host.  This is a common incident response scenario and this illustrates the power of Twistlock and Sumo Logic working together to identify the anomaly and to understand it more completely.  To do this, we simply add a little more logic to the query:

(_sourceCategory=twistlock_logs (Process violation)) AND _sourcehost = “cto-stable-ubuntu.c.cto-sandbox.internal”

6
Perhaps you’re looking for a specific action that an attacker took, like running netcat, something that should likely never happen in your production containers.  Again, because of Twistlock’s runtime defense, this anomaly is automatically detected as soon as it occurs without any human having to create a rule to do so.  Because Twistlock understands the entrypoint on the image, how the container was launched via Docker APIs, and builds a predictive runtime model via machine learning, it can immediately identify the unexpected process activity.  Once this data is in Sumo Logic, it’s easy to drill down even further and look for it:

(_sourceCategory=twistlock_logs (Process violation)) AND _sourcehost = “cto-stable-ubuntu.c.cto-sandbox.internal” AND nc

7

Of course, with Sumo Logic, you could also build much more sophisticated queries, for example, looking for any process violation that occurs on hosts called prod-* and is not caused by a common shell launching.  Even more powerfully, you can correlate and visualize trends across multiple hosts.  To take our example further, imagine we wanted to not just look for a specific process violation, but instead to visualize trends over time.  The Twistlock dashboard provides good basic visualizations for this, but if you want to have full control of slicing and customizing the views, that’s where a tool like Sumo Logic really shines.

Here’s an example of us looking for process violations over time, grouped in 5 minute timeslices, and tracked per host, then overlaid on a line chart:

_sourceCategory=twistlock_logs (Process violation)| timeslice 5m | count as count by _timeslice, _sourceHost| transpose row _timeslice column _sourceHost

8

Of course, this just touches on some of the capabilities once Twistlock’s container security data is in a powerful tool like Sumo Logic.  You may also build dashboards to summarize and visualize important queries, configure specific views of audit data to be available to only specific teams, and integrate container security event alerting into your overall security alert management process.  Once the data is in, the possibilities are limitless.

Create a dashboard

Here we go over the steps of which to create a dashboard in Sumologic to show and analyze some of this data

  • Login to Sumo Logic
  • Create a new search
  • Use the following query: (Replace twistlock/example with the tags you used when creating the Twistlock collector)
    • _sourceCategory=twistlock/example (violation) | timeslice 24h | count by _timeslice | order by _timeslice desc
    • Run the query and select the Aggregates tab
    • You should be looking at a list of dates and their total count of violations

9

  • Select the single value viewer from the Aggregate Tab’s toolbar

10

  • Click the “Add to dashboard” button on the right hand side to start creating a new dashboard by adding this chart as a panel
  • Create the new panel
    • Enter a title for example: Violations (last 24 hours)
    • Enter a new dashboard name for example: Overview Dashboard

11

  • Click Add

12

  • As an optional step you can set coloring ranges for these values. This will help you quickly identify areas that need attention.
    • When editing the value choose Colors by Value Range… from the cog in the Aggregate Tab’s toolbar

13

    • Enter 1 – 30 and choose green for the color
    • Click Save
    • Enter 31-70 and choose orange for the color
    • Enter 71 – (leave blank) and choose red for the color
    • Click Save

14

  • Create single value viewers using the same process as above for each of the queries below: (Replace twistlock/example with the tags you used when creating the Twistlock collector)
    1. Network Violations
      • _sourceCategory=twistlock/example (Network violation) | timeslice 24h | count by _timeslice | order by _timeslice desc
    2. Process Violations
      • _sourceCategory=twistlock/example (Network violation) | timeslice 24h | count by _timeslice | order by _timeslice desc
  • Your dashboard should look similar to this

15

  • Create another chart using the same process as above but this time use the search query: (Replace twistlock/example with the tags you used when creating the Twistlock collector)
  • _sourceCategory=”twistlock/kevin” (violation) | timeslice 1d | count by _timeslice | order by _timeslice asc
  • Run the query and select the Aggregates tab
  • You should be looking at a list of dates and their total number of violations
  • Select the area chartfrom the Aggregate Tab’s toolbar
  • Click the “Add to dashboard” button on the right hand side to start creating a new dashboard by adding this chart as a panel
  • Create the new dashboard panel
    • Enter a title for example: Violations by day
    • Select Overview Dashboard as the dashboard

16

    • Click Add
    • Resize the line chart so it extends the full width of the dashboard by clicking and dragging on the bottom right corner of the area chart panel
    • Your dashboard should now look similar to the one below

17

  • Use the following query: (Replace twistlock/example with the tags you used when creating the Twistlock collector)
    • _sourceCategory=”twistlock/example” (Denied)|parse “The command * * for user * by rule *’” as command, action, user, rulename | count by user | order by user asc
    • Run the query and select the Aggregates tab
    • You should be looking at a list of users and their total count of violations

18

  • Select the column chart iconfrom the Aggregate Tab’s toolbar

19

  • Click the “Add to dashboard” button on the right hand side to start creating a new dashboard by adding this chart as a panel
  • Create the new panel
    • Enter a title for example: Top Users with Violations
    • Enter a new dashboard name for example: Overview Dashboard

20

  • Click Add

23

  • Create another chart using the same process as above but this time use the search query: (Replace twistlock/example with the tags you used when creating the Twistlock collector)
  • _sourceCategory=”twistlock/example” (violation) | parse “.go:* * violation ” as linenumber, violation_type | count by violation_type | order by _count desc
  • Create the new panel
    • Enter a title for example: Top Violation by Types
    • Select Overview Dashboard as the dashboard

22

  • Click Add
  • Your completed dashboard should now look similar to the one below

23

In summary, integrating Twistlock and Sumo Logic gives users powerful and automated security protection for containers and provides advanced analytic capabilities to fully understand and visualize that data in actionable ways.  Because both products are built around open standards, integration is easy and users can begin reaping the benefits of this combined approach in minutes.

5 Log Monitoring Moves to Wow Your Business Partner

$
0
0

Log Monitoring - Sumo LogicLooking for some logging moves that will impress your business partner? In this post, we’ll show you a few. But first, a note of caution:

If you’re going to wow your business partner, make a visiting venture capitalist’s jaw drop, or knock the socks off of a few stockholders, you could always accomplish that with something that has a lot of flash, and not much more than that, or you could show them something that has real and lasting substance, and will make a difference in your company’s bottom line. We’ve all seen business presentations filled with flashy fireworks, and we’ve all seen how quickly those fireworks fade away.

Around here, though, we believe in delivering value—the kind that stays with your organization, and gives it a solid foundation for growth. So, while the logging moves that we’re going to show you do look good, the important thing to keep in mind is that they provide genuine, substantial value—and discerning business partners and investors (the kind that you want to have in your corner) will recognize this value quickly.

Why Is Log Monitoring Useful?

What value should logs provide? Is it enough just to accumulate information so that IT staff can pick through it as required? That’s what most logs do, varying mostly in the amount of information and the level of detail. And most logs, taken as raw data, are very difficult to read and interpret; the most noticeable result of working with raw log data, in fact, is the demand that it puts on IT staff time.

5 Log Monitoring Steps to Success

Most of the value in logs is delivered by means of systems for organizing, managing, filtering, analyzing, and presenting log data. And needless to say, the best, most impressive, most valuable logging moves are those which are made possible by first-rate log management. They include:

  • Quick, on-the-spot, easy-to-understand analytics. Pulling up instant, high-quality analytics may be the most impressive move that you can make when it comes to logging, and it is definitely one of the most valuable features that you should look for in any log management system. Raw log data is a gold mine, but you need to know how to extract and refine the gold. A high-quality analytics system will extract the data that’s valuable to you, based on your needs and interests, and present it in ways that make sense. It will also allow you to quickly recognize and understand the information that you’re looking for.
  • Monitoring real-time data. While analysis of cumulative log data is extremely useful, there are also plenty of situations where you need to see what is going on right at the moment. Many of the processes that you most need to monitor (including customer interaction, system load, resource use, and hostile intrusion/attack) are rapid and transient, and there is no substitute for a real-time view into such events. Real-time monitoring should be accompanied by the capacity for real-time analytics. You need to be able to both see and understand events as they happen.
  • Fully integrated logging and analytics. There may be processes in software development and operations which have a natural tendency to produce integrated output, but logging isn’t one of them. Each service or application can produce its own log, in its own format, based on its own standards, without reference to the content or format of the logs created by any other process. One of the most important and basic functions that any log management system can perform is log integration, bringing together not just standard log files, but also event-driven and real-time data. Want to really impress partners and investors? Bring up log data that comes from every part of your operation, and that is fully integrated into useful, easily-understood output.
  • Drill-down to key data. Statistics and aggregate data are important; they give you an overall picture of how the system is operating, along with general, system-level warnings of potential trouble. But the ability to drill down to more specific levels of data—geographic regions, servers, individual accounts, specific services and processes —is what allows you to make use of much of that system-wide data. It’s one thing to see that your servers are experiencing an unusually high level of activity, and quite another to drill down and see an unusual spike in transactions centered around a group of servers in a region known for high levels of online credit card fraud. Needless to say, integrated logging and scalability are essential when it comes to drill-down capability.
  • Logging throughout the application lifecycle. Logging integration includes integration across time, as well as across platforms. This means combining development, testing, and deployment logs with metrics and other performance-related data to provide a clear, unified, in-depth picture of the application’s entire lifecycle. This in turn makes it possible to look at development, operational, and performance-related issues in context, and see relationships which might not be visible without such cross-system, full lifecycle integration.

Use Log Monitoring to Go for the Gold

So there you have it—five genuine, knock-’em-dead logging moves. They’ll look very impressive in a business presentation, and they’ll tell serious, knowledgeable investors that you understand and care about substance, and not just flash. More to the point, these are logging capabilities and strategies which will provide you with valuable (and often crucial) information about the development, deployment, and ongoing operation of your software.

Logs do not need to be junkpiles of unsorted, raw data. Bring first-rate management and analytics to your logs now, and turn those junk-piles into gold.

5 Log Monitoring Moves to Wow Your Business Partner is published by the Sumo Logic DevOps Community. If you’d like to learn more or contribute, visit devops.sumologic.com. Also, be sure to check out Sumo Logic Developers for free tools and code that will enable you to monitor and troubleshoot applications from code to production.

About the Author

Michael Churchman started as a scriptwriter, editor, and producer during the anything-goes early years of the game industry. He spent much of the ‘90s in the high-pressure bundled software industry, where the move from waterfall to faster release was well under way, and near-continuous release cycles and automated deployment were already de facto standards. During that time he developed a semi-automated system for managing localization in over fifteen languages. For the past ten years, he has been involved in the analysis of software development processes and related engineering management issues.

Docker Security – 6 Ways to Secure Your Docker Containers

$
0
0

Docker SecuritySecurity was once the bane of Docker containers. As recently as 2014, bloggers were writing things like “using containers for security isolation is not a good idea” and that Docker is not safe “in absolute terms.”

Fast forward to 2016, however, and a lot has changed. Thanks to new features from Docker itself, as well as the introduction of crucial security tools elsewhere in the container ecosystem, it has become much easier to secure Docker containers.

Here, I’ll take a look at common container security challenges, and the tools and strategies you can use to solve or mitigate them.

Docker Security Challenges

Let’s start by going over the security issues that containers pose. This is important because security threats on containers fall into several different categories.

They include, first, the risk of privilege escalation via containers. For example, if an attacker can get root inside a containerized app, that could become a stepping stone to gaining root access to the host system.

Another security threat is an attack originating from one container that compromises data or resources used by a different container. This could potentially happen even without getting root access.

Similarly, you could face simple DoS attacks where one container seizes control of all available system resources in order to stop other containers from operating properly.

Last but certainly not least is the risk of insecure or unvalidated app images. Part of the magic of containers is how quickly and easily they let you spin up apps based on images that you pull from a repository. If you’re downloading from a public repository, however, there is a risk that you’ll get an image containing malicious code, or that someone has tampered with the repo’s authentication mechanism to insert a malicious image in the place of what appears to be a validated, signed image.

Why Containers Present Special Security Challenges

Some of these threats are par for the course in any type of computing environment. Security validation is always an issue with a public code repository, for instance.

But with Docker containers, the threats are amplified in certain respects. For instance, the privilege escalation issue would not be as serious if you were using a traditional hypervisor, like KVM or Hyper-V. There, the virtual environment would be strictly abstracted from the host system.

But with Docker, a process running inside a container has the same namespace as one on the host system by default. That makes it much easier for someone who gains root inside a container to get root on the host system. With traditional virtualization, in contrast, getting root access on a guest won’t do much to help you become root on the host.

Repository validation and image signing also arguably represent special threats in the container world. That’s because it has become common for admins to pull images from public repositories maintained by people they don’t know. This is a cultural issue more than a technical one. But it’s also a problem that isn’t as serious within the context of public repos used for other purposes, like installing packages on a Linux system. There, admins tend to stick to the “official” repositories and packages delivered by the maintainers of their distribution.

Protecting Your Docker Containers

All of the above is to say that security is a serious concern when it comes to containers, and that there are some unique challenges in this area. Fortunately, however, there are also some unique solutions that make it easy to address these concerns. Here are 6 ways you can secure Docker containers.

  1. Always make sure to start Docker containers with the -u flag so that they run as an ordinary user instead of root. This is a basic first step toward improving security.
  2. Taking the previous point a step further, remove SUID flags from your container images. This makes privilege escalation attacks even harder.
  3. Configure Docker control groups (also known as cgroups), which let you set limits on how many resources each container can use. This will go a long way toward preventing container-based DoS attacks. (Note, however, that cgroups aren’t intended to help provide other security isolations between containers—to do that, you use namespaces.)
  4. Use namespaces in Docker to isolate containers from one another. Namespaces help assure that a user or process running inside one container can’t affect those in other containers.
  5. Don’t use images from repos you don’t trust. In particular, avoid public repos if they’re not from an official source and you don’t know the maintainer. This may sound like a no-brainer, but it’s worth noting because it’s sometimes so tempting to pull an image from a random registry.
  6. Consider using Clair (CoreOS’s container security scanner) to validate containers from your registries. You can use Clair to scan images locally or you can run it directly from public registry services that are supported (which, for now, include CoreOS’s own platform, Quay, as well as Dockyard).

Container security remains a challenge. But it’s no longer an issue that can’t be solved without the same basic level of vigilance as that demanded by any other type of security challenge in a modern computing environment. So, with the assistance of the tools above, go forth and secure your containers!

Docker Logging

Monitoring the events and output from Docker containers can also provide useful information. As Michael Floyd, Sumo Logic’s Head of Developer Programs explains in this blog, “Sumo Logic delivers a comprehensive strategy for monitoring your Docker infrastructure with a native collection source for events, stats, configurations and logs, and provides views into things like container performance for CPU, memory, and the network.” With the Sumo Logic App for Docker, there’s no need to parse different log formats, or manage logging dependencies between containers. Analytics like this can be useful in validating container resources. In addition, Sumo Logic’s advanced machine-learning and analytics capabilities can enable you to analyze, troubleshoot, and perform root cause analysis of issues surfacing from distributed container-based applications and Docker containers themselves.

Editor’s Note: Docker Security – 6 Ways to Secure Your Docker Containers is published by the Sumo Logic DevOps Community. If you’d like to learn more or contribute, visit devops.sumologic.com. Also, be sure to check out the Sumo Logic Open Source page for free tools and code that will enable you to monitor and troubleshoot applications from code to production.

About the Author

Chris Tozzi has worked as a journalist and Linux systems administrator. He has particular interests in open source, agile infrastructure and networking. He is Senior Editor of content and a DevOps Analyst at Fixate IO.


Confessions of a Sumo Dashboard Addict

$
0
0

Mean_Girls_2004_34When you think of Ulta Beauty, you most likely think of makeovers, not technology. But in fact, we’ve also been doing makeovers of our technology to bring together all the technical groups that touch our guests (application development, operations, e-commerce, plus our off-shore teams) under one organization to drive the best possible guest experience.

For those of you who aren’t familiar with Ulta Beauty, we’re the fastest growing beauty retailer with both brick and mortar and an online presence. Back in 2014, we experienced some challenges with online guest order fulfillment during the holiday season (our busiest time of the year). Our business partners simply lacked the visibility into inventory levels during peak season. We identified the problem in advance, but due to time constraints weren’t able to resolve so we took a novel approach using machine data analytics for better visibility.

We knew we needed a solution to streamline operations and proactively identify product trends. We selected Sumo Logic to help us get a real-time view of our order throughput so that we could manually bring down order levels if throughput went too high. In my role as VP of Guest-facing Services, I rely on deep technical knowledge and business sense to make sure our applications are running smoothly. Sumo Logic was easy enough for us to manage on our own. It’s flexible and simple but powerful, which enables me to ensure my business stakeholders are empowered with the information they need to be successful.

Fast forward to holiday season 2015. We not only improved our backend systems but also expanded and operationalized Sumo Logic with our DevOps, App Dev and Business Partner teams. We created multiple dashboards and reports to identify hot selling items, what’s trending, inventory levels and more. This was huge for our business partners, who could then consciously make inventory business decisions on their own. The biggest impact of rolling out Sumo Logic has been the ability to impact the guest experience in a positive way and effectively manage the channel.

I confess that I became a bit of a Sumo Logic dashboard addict. During the holiday season, if I was out and about, I would check the mobile view so frequently that I blew my cellular data plan.

What’s next for Ulta and Sumo Logic? We’re expanding our use of Sumo and validating new business use cases for point-of-sale, network infrastructure and warehouse management systems. With Sumo’s assistance, we’re creating an enterprise application performance management roadmap that incorporates Sumo Logic’s machine data analytics to ensure the maximum reliability and stability of our business-critical systems. Now that’s a beautiful makeover!


Top 5 Questions From DockerCon 2016

$
0
0

sumo_logic_dockercon_smallDevelopers, IT Ops engineers and enterprise professionals converged on DockerCon 2016 with a vengeance and Sumo Logic was on hand to show them how the Sumo Logic platform gives them visibility into their Docker ecosystems. We also released a new eBook for practitioners, Docker, From Code to Container that provides best practices for building, testing and deploying containers and includes hands-on exercises with Docker Compose. The Sumo Logic Community also announced a chance to win a DJI Phantom 3 Drone. The contest ends June 30, so there’s still time.

With announcements of new features like Containers as a Service and tools like Docker Universal Control Plane (UCP), Docker is taking the deployment of microservices via containers to a whole new level. UCP offers automated container scanning and the ability run signed binaries. As a primarily DevOps crowd with a heavy bent toward the developer, there was a lot of interest in Docker logging, monitoring and analytics, and we received a lot of questions about the internals of the Sumo Logic approach to collecting logs. In fact, the #1 question I got was how we implemented the container, so I thought I’d answer that and other questions here.

How Does Sumo Logic Operate in a Docker Ecosystem?

Sumo Logic uses a container to collect and ship data from Docker. The image itself contains a collector and a script source. You can grab the image from DockerHub by just running a Docker pull.

docker pull sumologic/appcollector:latest

Before you run the container, you’ll need to create an access key in Sumo Logic (see documentation for details). Then run the container using the AccessID and Access_key that you created previously.

docker run -d -v /var/run/docker.sock:/var/run/docker.sock --name="sumologic-docker" sumologic/appcollector:latest

The container creates a collector in your Sumo Logic account, and establishes two sources: Docker Logs and a Docker Stats.

That’s it. Once the image is installed and configured locally, you simply select the App for Docker from the Library in Sumo Logic, bring up the one of the dashboards and watch data begin to populate.

If you’d like to try it out yourself and don’t already have an account, sign up for Sumo Logic Free.

Can you monitor more than One Docker Host?

Another question I got was whether you could monitor more than one host. Apparently not all monitoring tools let you do this. The answer is, you can.

5 questions from dockercon

As you can see in this Overview Dashboard, there are two Docker Hosts in this example. The Sumo Logic collector image typically runs on the same host as the Docker host. You can collect data from multiple hosts by installing an image on each host. Note, however, that you can only run one instance at a time. A better approach is to run the Sumo Logic Collector on one host, and have containers on all other hosts log to it by setting the syslog address accordingly when running the container. Our CTO, Christian Beedgen explains more in this post on Logging Drivers.

What kind of data do you capture and what analytics do you provide?
To get real value from machine-generated data, Sumo Logic takes a comprehensive approach to monitoring Docker. There are five requirements to enable comprehensive monitoring:

  • Events
  • Configurations
  • Logs
  • Stats
  • Host and daemon logs

For events, you can send each event as a JSON message, which means you can use JSON as a way of logging each event. The Sumo Logic collector enumerates all running containers, then starts listening to the event stream, collecting each running container and each start event. See my post on Comprehensive Monitoring in Docker for more detail.

We call the inspect API to get configurations and send that in JSON. For logs, we call the logs API to open a stream and send each log. Now you have a record of all the configurations together with your logs, making it easy search for them when troubleshooting.

For statistics, we call the stats API to open a stream for each running container and each start event, and send each received JSON message as a log. For host and daemon logs, you can include a collector into host images or run a collector as a container.

Do you have any Free Stuff?

No conference would be complete with a new backpack stuffed with hoodies, T-shirts and may be a Red Hat (Thanks guys!) But I also believe in adding value by educating developers and ops. So, I’ve put together an eBook, Docker – From Code to Container, that I hope you’ll find interesting.

Docker From Code to Container explains how containerization enables Continuous Integration and Continuous Delivery processes, shows how you can take Docker to production with confidence, walks you through the process of building applications with Docker Compose, and presents a comprehensive model for monitoring Docker both your application stack and your Docker ecosystem.

Ultimately, you will learn how containers enable DevOps teams build, run and secure their Dockerized a applications. In this Webinar you will learn:

  • How Docker enables continuous integration and delivery
  • Best practices for delivering Docker containers to production
  • How to build Applications with Docker Compose
  • Best practices for securing docker containers
  • How to gauge the health of your Docker ecosystem using analytics
  • A comprehensive approach to monitoring and logging

What’s Next

I’m glad you asked. We’re featuring a Live Webinar with Jason Bloomberg, president of Intelyx and Kalyan Ramanathan, VP of Marketing for Sumo Logic to dive deeper into the use cases for Docker monitoring. The webinar is July 20 at 10:00 am PDT. Be there or be square!

Role-Based Access and Containers as a Service

$
0
0

Containers as a Service CaaSContainers as a Service (CaaS) is a new term that has arisen over the last several months. It strikes a nice middle ground between Infrastructure as a Service and Platform as a Service when deploying applications infrastructure. Infrastructure as a Service requires managing individual segments of infrastructure and entire low-level configurations in one or a number of Infrastructure as a Service providers. With Platform as a Service, alternatively, the application stack is dictated and the individual configuration and deployment capabilities are relatively fixed. With Containers as a Service, you are able to create more differentiation between application stacks and deployment methods than is possible with Platform as a Service, without the more significant training and resource requirements associated with Infrastructure as a Service.

Containers as a Service resolves the disconnect between developers deploying in production and operations teams needing to run those applications in production. By packaging applications in containers, you are able to maintain version control and configuration management required to deploy those applications stacks. Specific thought should be given to how apps and services are deployed across a highly scalable and resilient containerized architecture. Tightly coupled services should be grouped together, and stacks should be composed to link those individual services into logical groupings that can be deployed.

Role-Based Access Control

Role-Based Access Control (RBAC) is a method of managing specific permissions on accounts. These specific permissions can provide a highly refined access set, mapped specifically to the roles and responsibilities of a specific individual or group. On one side, these individuals are placed into groups in a logical fashion. On the other side, permissions are placed into roles that are commonly needed within the organization. Combining these two methods, groups can be placed into roles that map specifically and explicitly to the needs of the individual. This also allows for more easily configured provisioning and deprovisioning of individuals when they enter and leave an organization. Individual assignment to groups can also be accomplished through attribute assignment.

In the Containers as a Service context, these roles can then be applied to permit individuals to rapidly deploy applications with little risk to existing infrastructure. Different groups of individuals can be provided with permission to deploy into test, development, or production environments. By codifying and explicitly describing permission, integrations can occur more quickly, and delivery and deployment can occur in a more consistent way. Permissions provided with forethought allow for both greater control and greater agility for the operations team managing the production infrastructure.

In a more centralized and highly regulated organization, such controls can be put in place to ensure compliance where necessary. For example, for Sarbanes-Oxley (SOX) compliance, “regulators may need to know who used a system, when they logged in and out, what accesses or modifications were made to what files, and what authorizations were in effect.”1 These schemes typically require significant logging for changes to the environment. In a highly regulated environment, these opportunities also create a manageable way for providing lowest required access. In a decentralized environment, Role-Based Access Control provides greater agility while preventing significant divergence from a shared standard of deployment.

The most glaring and common downside of strict Role-Based Access Control is significantly restricted agility for decentralized organizations. If the application of this control is too strict, not only can progress be significantly slowed, but the ability of these divisions to independently explore their own solutions to unique problems is severely limited.

Balancing Containers as a Service and RBAC

One of the primary issues that virtualization originally attempted to solve was decoupling the hardware from the runtime environment. This primarily benefited the operations teams when running the application, providing greater resiliency. While the dream was not fully realized in many organizations with self-service virtualization, Containers as a Service have the potential to solve this for application deployments, which can also act as one of their primary selling points when introducing them into an environment, with the ability to generate quick wins, and in the long-term impact application deployment patterns. The balance is that if controls are too strictly placed onto the delegate organizations, it will increase time to deployment and decrease overall realized productivity.

This balance can be struck in a number of ways:

  • Regular review of permissions and role mappings, especially when groups are nested together, is very important. This is increasingly a pain point in a default-closed environment, as Container as a Service capabilities expand on a rapid and regular cadence.
  • Strict controls around highly critical lines of business applications have the ability to be significantly more restrictive than for other applications. This differentiation allows for flexibility and risk tolerance to be built upon and aligned with organizational expectations.
  • As is the case with Containers as a Service, and virtualization before it, multi-level, nested role groups increase abstraction of permissions from roles to provide greater flexibility when assigning these roles.
  • It is quite possible (and likely necessary) to nest multiple user groups together, then nest the top-level nested group into the lowest level role group. Another complementary approach is to permit multiple roles to be assigned to other user groups and individual users. Care has to be taken to avoid being overly granular to the point of unmanageability, but this allows the closest mapping to permissions and individuals. This can take the form of both functionally driven and organizational/hierarchical user groups.
  • Draw a distinction between visibility (which is important to nearly everyone in the organization) and the ability to take action.
  • A further differentiation can be defined for exceptions to the workflow or out-of-band needs.

The drive should be to create a workflow that accommodates nearly every case, significantly driving down one-off or special requests. If the environment generates a significant number of out-of-band process requirements, it will likely be less effective at driving original and useful developments that can be rapidly deployed through the standard workflow.

Ultimately, permission should be granted to foster agility within an organization while also providing sufficient controls to prevent unauthorized actors from causing disruptions. With Containers as a Service, we also have the opportunity to create an architecture that is increasingly resilient to accidental disruption. Pairing together Containers as a Service and having a strong framework for leveraging Role-Based Access Control will contribute to greater levels of control and transparency for the organization, as well as more rapid deployment of technologies that ultimately serve the end customer.

Editor’s Note: Role-Based Access and Containers as a Service is published by the Sumo Logic DevOps Community. If you’d like to learn more or contribute, visit devops.sumologic.com. Also, be sure to check out the Sumo Logic Open Source page for free tools, API’s and example code that will enable you to monitor and troubleshoot applications from code to production.

Resources

1. Sarbanes Oxley

NIST RBAC

Docker Blog on CaaS

About the Author

Over the last 10 years, Sara has held numerous program management, engineering, and operations roles. She has lead multiple team transformations and knows first hand the pain of traditional waterfall development. She is a vocal advocate for DevOps, microservices, and the cloud as tools to create better products and services. Sara is currently a contributor at Fixate.io and can be found on Twitter @sarajeanes.

New York State of Mind: Architecting the Cloud

$
0
0

Every time I go to NYC I get a sudden surge of energy along with some edginess. During my first meeting ever in NYC I had a guy tell me, “You have 15 bleep bleep and bleep minutes to show me some value or your bleep is out the door.” I love this attitude because you know EXACTLY where you stand. The city that never sleeps sets the tone and pecking order when it comes to trends. I say usually because for the last two or three years, the good people of NYC have seemed a bit behind in technology and cloud services.

Last week I was lucky enough to do present at the “Architecting the Cloud” Symposium for IANS in New York and as I prepared for the session, my first thought was, “make sure you bring them along slowly.”

Here is what I learned from the 50 or so people in attendance across a wide range in verticals including, healthcare, finance, retail, telecommunications and government:

– Most of the folks there are adopting SaaS (Office365, Salesforce, BOX)

– Many are using Amazon Web Services (AWS) for at least a few use cases like DR or Development work

– Almost everyone is looking at Microsoft Azure as a viable option

– Several people mentioned bifurcating workloads between providers

– People are looking for good MSSP/MSP’s to help with the transition between BiModel 1 & 2

– Traditional tool sets are not working for Cloud Computing (DLP, SIEM, Deep Packet Inspection)

– Cloud Access Security Brokers (CASB) is hot, the Symantec Acquisition of Blue Coat (Elastica) is just the beginning

– Is User Behavior Analytics (UBA) real and who is doing it well?

To add some more detail, it is hard to stand up solutions that work both on premise and off premise. It is also extremely difficult to ingest data from multiple sources that are on the cloud. Security professionals are combining potentially competitive solutions like ELK and QRadar. ELK to gather logs via API’s from AWS then porting them into Radar for analysis. Problem being, two vendors = finger pointing and lack of scale.

This problem is not unique to NYC, as SaaS-based apps and IaaS start taking over, logs, scale and automation are still an issue in the security space.

Why is this so hard of a problem to solve? And why would anyone buy more on-premise infrastructure to manage cloud-based workloads? At Sumo Logic it seems like we have a real opportunity to change the game as we shift our focus to Security Analytics. Am I correct in thinking that this is what the world wants us to do?

Also what MSSP’s/ MSP’s do people like out there? I have a few thoughts and while the feedback at the Symposium was valuable, it was mostly negative.

So like the good people of NYC, please be direct and straight forward with your comments. I expect to hear back from you bleeping people soon.

Sumo Logic Now Monitors and Optimizes MongoDB Deployments

$
0
0

This week I attended MongoDB World in New York and had the opportunity to present on how Sumo Logic helps monitor and optimizes MongoDB deployments through our new Sumo Logic’s App for MongoDB which was announced at the event. The new app provides a deeper,  in-depth view into the operational health and performance of MongoDB deployments, and provides the visibility needed to enable the flexibility to monitor, optimize and secure modern applications powered by modern database engines that today’s digital businesses require.

We worked closely with MongoDB to define monitoring use-cases that mattered most MongoDB devs and admins alike. The Sumo Logic App for MongoDB dashboards can:

  1. Help you identify and troubleshoot slow queries
  2. Monitor the health of your MongoDB deployment – whether it consists of only a couple of Mongo instances, or if it’s a complex deployment like replica sets and sharded clusters
  3. Understand the security of your MongoDb deployment and easily evaluate whether a login or connection is legit or an indication that your database is under attack

Thinking Ahead with Monitoring

We had a steady stream of visitors to our booth – many of whom (as expected) were already fairly advanced MongoDB users, looking to get greater visibility into their database performance. However, what surprised me was that we also got quite a few folks, who were on older database technologies such as Oracle and looking to transition to modern database models such as MongoDB. hile they are still evaluating MongoDB, they were already thinking about how to monitor and report on database operational activity.

Another common transition story I heard involved change in management, where the incoming team wanted greater visibility into operations and performance, and quickly. It was then up to the existing team to go figure out how to report on their entire application stack performance, and quickly. These stories signal that IT is really struggling with getting a holistic view into the health of their database deployments, so they can better monitor performance, diagnose problems and audit access to identify potential risks.

Next week I’ll be sharing more observations and learnings from MongoDB World so stay tuned!

Viewing all 1036 articles
Browse latest View live