Quantcast
Channel: Blog – Sumo Logic
Viewing all 1036 articles
Browse latest View live

Managing Container Data Using Docker Data Volumes

$
0
0

docker data volumesDocker data volumes are designed to solve one of the deep paradoxes of containers, which is this: For the very same reasons that containers make apps highly portable — and, by extension, create more nimble data centers — they also make it hard to store data persistently. That’s because, by design, containerized apps are ephemeral. Once you shut down a container, everything inside it disappears. That makes your data center more flexible and secure, since it lets you spin up apps rapidly based on clean images. But it also means that data stored inside your containers disappears by default.

How do you resolve this paradox? There are actually several ways. You could jerry-rig a system for loading data into a container each time it is spun up ( via SSH, for example), then exporting it somehow, but that’s messy. You could also turn to traditional distributed storage systems, like NFS, which you can access directly over the network. But that won’t work well if you have a complicated (software-defined) networking situation (and you probably do in a large data center). You’d think someone would have solved the Docker container storage challenge in a more elegant way by now — and someone has! Docker data volumes provide a much cleaner, straightforward way to provide persistent data storage for containers.

That’s what I’ll cover here. Keep reading for instructions on setting up and deploying Docker data volumes (followed by brief notes on storing data persistently directly on the host).

Creating a Docker Data Volume

To use a data volume in Docker, you first need to create a container to host the volume. This is pretty basic. Just use a command like:

docker create -v /some/directory mydatacontainer debian

This command tells Docker to create a new container named mydatacontainer based on the Debian Docker image. (You could use any of Docker’s other OS images here, too.) Meanwhile, the -v flag in the command above sets up a storage container in the directory /some/directory inside the container.

To repeat: That means the data is stored at /some/directory inside the container called mydatacontainer — not at /some/directory on your host system.

The beauty of this, of course, is that we can now write data to /some/directory inside this container, and it will stay there as long as the container remains up.

Using a Data Volume in Docker

So that’s all good and well. But how do you actually get apps to use the new data volume you created?

Pretty easily. The next and final step is just to start another container, using the –volumes-from flag to tell Docker that this new container should store data in the data volume we created in the first container.

Our command would look something like this:

docker run --volumes-from mydatacontainer --volumes-from debian

Now, any data changes made inside the container debian will be saved inside mydatacontainer at the directory /some/directory.

And they’ll stay there if you stop debian — which means this is a persistent data storage solution. (Of course, if you stop mycontainervolume, then you’ll also lose the data inside.)

You can have as many data volumes as you want, by the way. Just specify multiple ones when you run the container that will access the volumes.
Data Storage on Host instead of a container?

You may be thinking, “What if I want to store my data directly on the host instead of inside another container?”

There’s good news. You can do that, too. We won’t use data storage volumes for this, though. Instead, we’ll run a command like:

docker run -v /host/dir:/container/dir -i image

This starts a new container based on the image image and maps the directory /host/dir on the host system to the directory /container/dir inside the container. That means that any data that is written by the container to /container/dir will also appear inside /host/dir on the host, and vice versa.

There you have it. You can now have your container data and eat it, too. Or something like that.

About the Author

Hemant Jain is the founder and owner of Rapidera Technologies, a full service software development shop. He and his team focus a lot on modern software delivery techniques and tools. Prior to Rapidera he managed large scale enterprise development projects at Autodesk and Deloitte.

Managing Container Data Using Docker Data Volumes is published by the Sumo Logic DevOps Community. If you’d like to learn more or contribute, visit devops.sumologic.com. Also, be sure to check out Sumo Logic Developers for free tools and code that will enable you to monitor and troubleshoot applications from code to production.


Application Containers vs. System Containers: Understanding the Difference

$
0
0

When people talk about containers, they usually mean application containers. Docker is automatically associated with application containers and is widely used to package applications and services. But there is another type of container: system containers. Let us look at the differences between application containers vs. system containers and see how each type of container is used:


Application Containers System Containers
Images
  • Application/service centric
  • Growing tool ecosystem
  • Machine-centric
  • Limited tool ecosystem
Infrastructure
  • Security concerns
  • Networking challenges
  • Hampered by base OS limitations
  • Datacenter-centric
  • Isolated & secure
  • Optimized networking

The Low-Down on Application Containers

Application containers are used to package applications without launching a virtual machine for each app or each service within an app. They are especially beneficial when making the move to a microservices architecture, as they allow you to create a separate container for each application component and provide greater control, security and process restriction. Ultimately, what you get from application containers is easier distribution. The risks of inconsistency, unreliability and compatibility issues are reduced significantly if an application is placed and shipped inside a container.

Docker is currently the most widely adopted container service provider with a focus on application containers. However, there are other container technologies like CoreOS’s Rocket. Rocket promises better security, portability and flexibility of image sharing. Docker already enjoys the advantage of mass adoption, and Rocket might just be too late to the container party. Even with its differences, Docker is still the unofficial standard for application containers today.

System Containers: How They’re Used

System containers play a similar role to virtual machines, as they share the kernel of the host operating system and provide user space isolation. However, system containers do not use hypervisors. (Any container that runs an OS is a system container.) They also allow you to install different libraries, languages, and databases. Services running in each container use resources that are assigned to just that container.

System containers let you run multiple processes at the same time, all under the same OS and not a separate guest OS. This lowers the performance impact, and provides the benefits of VMs, like running multiple processes, along with the new benefits of containers like better portability and quick startup times.

Useful System Container Tools

Joyent’s Triton is a Container as a Service that implements its proprietary OS called SmartOS. It not only focuses on packing apps into containers but also provides the benefits of added security, networking and storage, while keeping things lightweight, with very little performance impact. The key differentiator is that Triton delivers bare-metal performance. With Samsung’s recent acquisition of Joyent, it’s left to be seen how Triton progresses.

Giant Swarm is a hosted cloud platform that offers a Docker-based virtualization system that is configured for microservices. It helps businesses manage their development stack, spend less time on operations setup, and more time on active development.

LXD is a fairly new OS container that was released in 2016 by Canonical, the creators of Ubuntu. It combines the speed and efficiency of containers with the famed security of virtual machines. Since Docker and LXD share the same kernels, it is easy to run Docker containers inside LXD containers.

Ultimately, understanding the differences and values of each type of container is important. Using both to provide solutions for different scenarios can’t be ruled out, either, as different teams have different uses. The development of containers, just like any other technology, is quickly advancing and changing based on newer demands and the changing needs of users.

Monitoring Your Containers

Whatever the type of container, monitoring and log analysis is always needed. Even with all of the advantages that containers offer as compared to virtual machines, things will go wrong.

That is why it is important to have a reliable log-analysis solution like Sumo Logic. One of the biggest challenges of Docker adoption is scalability, and monitoring containerized apps. Sumo Logic addresses this issue with its container-native monitoring solution. The Docker Log Analysis app from Sumo Logic can visualize your entire Docker ecosystem, from development to deployment. It uses advanced machine learning algorithms to detect outliers and anomalies when troubleshooting issues in distributed container-based applications. Sumo Logic’s focus on containers means it can provide more comprehensive and vital log analysis than traditional Linux-based monitoring tools.

About the Author

Twain began his career at Google, where, among other things, he was involved in technical support for the AdWords team. His work involved reviewing stack traces, and resolving issues affecting both customers and the Support team, and handling escalations. Later, he built branded social media applications, and automation scripts to help startups better manage their marketing operations. Today, as a technology journalist he helps IT magazines, and startups change the way teams build and ship applications.

Application Containers vs. System Containers: Understanding the Difference is published by the Sumo Logic DevOps Community. If you’d like to learn more or contribute, visit devops.sumologic.com. Also, be sure to check out Sumo Logic Developers for free tools and code that will enable you to monitor and troubleshoot applications from code to production.

Sending JMX Metrics to Sumo Logic Unified Logs and Metrics

$
0
0

This is a brief excerpt of how Mayvenn started sending JMX metrics to  Sumo Logic Unified Logs and Metrics solution. For the full blog post please visit Mayvenn’s engineering blog.

We’ve been using Sumo Logic for logs and were excited to have one tool and dashboard to visualize logs and metrics! In order to wire this up, we decided to use jmxtrans to regularly pipe the JMX metrics we query with Graphite formatted output to the new Sumo Logic collectors. These collectors can essentially be thought of a hosted version of Graphite.

Step 1: Upgrade/Install Sumo Logic Collectors

There’s a lot of guides out there on this one, but just in case you have existing collectors, they do need to be updated to have the new Graphite source.

Step 2: Add a Graphite Source for the Collector

This step can either be done in the Sumo Logic dashboard or through a local file for the collector that configures the sources. Either way, you will need to decide what port to run the collector on and whether to use TCP or UDP. For our purposes, the standard port of 2003 is sufficient and we don’t have an extremely high volume of metrics with network/CPU concerns to justify UDP.

For configuring this source in the dashboard, the Sumo Logic guide to adding a Graphite source does a pretty thorough walkthrough. To summarize, though, the steps are pretty simple: go to to the collector management page, select the relevant collector, click add source, choose the Graphite source and configure it with the port and TCP/UDP choices. This method is certainly fast to just try out Sumo Logic metrics.

Docker 1.12: What You Need to Know

$
0
0

docker-1.12 at Sumo LogicDocker 1.12 was announced at DockerCon in June and we’ve had a chance to digest some of the new features. Sumo Logic provides the App for Docker, which is a great tool for collecting docker logs and visualizing your Docker ecosystem. So I wanted to look at what’s new and significant in this latest Docker release? Keep reading for a summary of new features in Docker 1.12.

For the record, as I’m writing this, Docker 1.12 has not yet been released for production. It’s still on RC4. But based on the information that Docker has released so far about Docker 1.12, as well as the changelogs on GitHub, it’s pretty clear at this point what the new release is going to look like.

The big news: Swarm is now built into Docker

By far the biggest (and most widely discussed) change associated with Docker 1.12 is that Swarm, Docker’s homegrown container orchestration tool, is now built into Docker itself. Docker announced this change with much fanfare at Dockercon back in June.

Built-in Swarm means that Docker now offers container orchestration out of the box. There is no additional work required for setting up an orchestrator to manage your containers at scale.

At the same time, Docker is keen to emphasize that it is committed to avoiding vendor lock-in. Kubernetes and other container orchestrators will remain compatible with Docker 1.12.

Of course, by offering Swarm as an integral part of the Docker platform, Docker is strongly encouraging organizations to use its own orchestration solution instead of a third-party option. That has important implications for companies in the Docker partner ecosystem. They now arguably have less incentive to try to add value to Docker containers by simplifying the management end of things, since Docker is doing that itself with built-in Swarm.

As far as Docker users (as opposed to partners) go, however, Swarm integration doesn’t have many drawbacks. It makes Swarm an easy-to-deploy orchestration option without invalidating other solutions. And Swarm itself still works basically the same way in Docker 1.12 as it did with earlier releases.

Version 1.12 feature enhancements

Built-in Swarm is not the only significant change in Docker 1.12. The release also offers many technical feature enhancements. Here’s a rundown…

Networking

Docker container networking continues to evolve. Two years ago it was difficult to network containers effectively at all.

Now, Docker 1.12 brings features like built-in load balancing using virtual IPs and secured multi-host overlay networking. There are new networking tools built into Docker 1.12 as well, including the –link-local-ip flag for managing a container’s link-local address.

Container management

Docker 1.12 can do a fair number of cool new things when it comes to managing containers.

Containers can now keep running even if the Docker daemon shuts down using the –live-restore flag. You can get execution traces in binary form using trace on the Docker CLI. Docker supports disk quotas on btrfs and zfs, the most common Linux file systems after ext4 (and maybe ext3).

Perhaps most interestingly, Docker 1.12 also features experimental support for a plugin system. You can use the plugin command to install, enable and disable Docker plugins, as well as perform other tasks. The list of Docker plugins currently remains relatively small, but expect it to grow as the plugin system matures.

Log Management

Log reading and writing has improved for Docker 1.12, too. Docker logs now play more nicely with syslog, thanks to the introduction of support for DGRAM sockets and the rfc5424micro format, among other details. You can also now use the –details argument with docker logs to specify log tags.

Remote API

Last but not least are changes to the Docker API for managing remote hosts. Several new options and filters have been introduced in Docker 1.12. In addition, authorization has been enhanced with TLS user information, and error information is returned in JSON format for easier processing.

The remote API binary has also now been split into two programs: the docker client and dockerd daemon. That should make things simpler for people who are used to working with the Docker CLI.

There’s even more to v1.12

The list of changes in Docker 1.12 could go on. I’ve outlined only the most significant ones here.

But by now, you get the point: Docker 1.12 is about much more than just a bump up in the version number. It introduces real and significant changes, highlighted by additional features that provide novel functionality. And there’s built-in Swarm, too, for those who want it.

Editors note: Docker 1.12: What You Need to Know is published by the Sumo Logic DevOps Community. If you’d like to learn more or contribute, visit devops.sumologic.com. Also, be sure to check out Sumo Logic Developers for free tools and code that will enable you to monitor and troubleshoot applications from code to production.

About the Author

Chris Tozzi has worked as a journalist and Linux systems administrator. He has particular interests in open source, agile infrastructure and networking. He is Senior Editor of content and a DevOps Analyst at Fixate IO.

Who Broke My Test? A Git Bisect Tutorial

$
0
0

Git bisect is a great way to help narrow down who (and what) broke something in your test—and it is incredibly easy to learn. This Git Bisect tutorial will guide you through the basic process.

So, what is Git bisect?

What exactly is it? Git bisect is a binary search to help find the commit that introduced a bug. Not only is it a great tool for developers, but it’s also very useful for testers (like myself).

I left for the weekend with my Jenkins dashboard looking nice and green. It was a three-day weekend—time to relax! I came in Tuesday, fired up my machine, logged into Jenkins…RED. I had to do a little bit of detective work.

Luckily for me, a developer friend told me about git bisect (I’m relatively new to this world), and helped me quickly track down which commit broke my tests.

Getting started with Git bisect

First, I had to narrow down the timeline. (Side note—this isn’t really a tool if you’re looking over the last few months, but if it’s within recent history—days—it’s handy). Looking at my build history in Jenkins, I noted the date/times I had a passing build (around 11 AM), and when it started showing up red (around 5 PM).

I went into SourceTree and found a commit from around 11 AM that I thought would be good. A simple double-click of that commit and I was in. I ran some tests against that commit, and all passed, confirming I had a good build. It was time to start my bisect session!


git bisect start
git bisect good

Narrowing down the suspects

Now that I’d established my GOOD build, I had time to figure out where I thought the bad build occured. Back to SourceTree! I found a commit from around 5 PM (where I noticed the first failure), so I thought I’d check that one out. I ran some more tests. Sure enough, they failed. I marked that as my bad build.


git bisect bad

I had a bunch of commits between the good and bad (in my case, 15), and needed to find which one between our 11 AM and 5 PM run broke our tests. Now, without bisect, I might have had to pull down each commit, run my tests, and see which started failing between good and bad. That’s very time-consuming. But git bisect prevents you from having to do that.

When I ran git bisect bad, I got a message in the following format:

Bisecting: revisions left to test after this (roughly steps)

[<commit number>] <Commit Description>


This helped identify the middle commit between what I identified as good and bad, cutting my options in half. It told me how many revisions were between the identified commit and my bad commit (previously identified), how many more steps I should have to find the culprit, and which commit I next needed to look at.

Then, I needed to test the commit that bisect came up with. So—I grabbed it, ran my tests—and they all passed.

git bisect good

This narrowed down my results even further and gave me a similar message. I continued to grab the commit, run tests, and set them as git good until I found my culprit—and it took me only three steps (versus running through about 15 commits)! When my tests failed, I had to identify the bad commit.


git bisect bad

<commit number> is the first bad commit
<commit number>
Author: <name>
Date: <date and time of commit>

Aha! I knew the specific commit that broke my test, who did it, and when. I had everything I needed to go back to the engineer (with proof!) and start getting my tests green again.

git-bisect-sumo-logic

Getting to the Root Cause

When you are in the process of stabilizing tests, it can be fairly time-consuming to determine if a failure is a result of a test, or the result of an actual bug. Using git bisect can help reduce that time and really pinpoint what exactly went wrong. In this case, we were able to quickly go to the engineer, alert the engineer that a specific commit broke the tests, and work together to understand why and how to fix it.

Of course, in my perfect world, it wouldn’t only be my team that monitors and cares about the results. But until I live in Tester’s Utopia, I’ll use git bisect.

Who Broke My Test? A Git Bisect Tutorial is published by the Sumo Logic DevOps Community. If you’d like to learn more or contribute, visit devops.sumologic.com. Also, be sure to check out Sumo Logic Developers for free tools and code that will enable you to monitor and troubleshoot applications from code to production.

About the Author

AshleyAshley Hunsberger is a Quality Architect at Blackboard, Inc. and co-founder of Quality Element. She’s passionate about making an impact in education and loves coaching team members in product and client-focused quality practices. Most recently, she has focused on test strategy implementation and training, development process efficiencies, and preaching Test Driven Development to anyone that will listen. In her downtime, she loves to travel, read, quilt, hike, and spend time with her family.

Building Software Release Cycle Health Dashboards in Sumo Logic

$
0
0

Gauging the health and productivity of a software release cycle is notoriously difficult. Atomic age metrics like “man months” and LOCs may be discredited, but they are too often a reflexive response for DevOps problems.

Instead of understanding the cycle itself, management may hire a “DevOps expert” or homebrew one by taking someone off their project and focusing them on “automation.” Or they might add man months and LOCs with more well-intentioned end-to-end tests.

What could go wrong? Below, I’ve compiled some metrics and tips for building a release cycle health dashboard using Sumo Logic.

Measuring Your Software Release Cycle Speed

Jez Humble points to some evidence that delivering faster not only shortens feedback but also makes people happier, even on deployment days. Regardless, shorter feedback cycles do tend to bring in more user involvement in the release, resulting in more useful features and fewer bugs. Even if you are not pushing for only faster releases, you will still need to allocate resources between functions and services. Measuring deployment speed will help.

Change lead time: Time between ticket accepted and ticket closed.
Change frequency: Time between deployments.
Recovery Time: Time between a severe incident and resolution.

To get this data to Sumo Logic, ingest your SCM and incident management tools. While not typical log streams, the tags and timestamps are necessary to tracking the pipeline. You can return deployment data from your release management tools.
Tracking Teams, Services with the Github App
To avoid averaging out insights, Separately tag services and teams in each of the tests above. For example, if a user logic group works on identities and billing, track billing and identity services separately.

For Github users, there is an easy solution, the Sumo Logic App for Github, which is currently available in preview. It generates pre-built dashboards in common monitoring areas like security, commit/pipeline and issues. More importantly, each panel provides queries that can be repurposed for separately tagged, team-specific panels.

Reusing these queries allows you to build clear pipeline visualizations very quickly. For example, let’s build a “UI” team change frequency panel.

First, create a lookup table designating UserTeams. Pin it to saved queries as it can be used across the dashboard to break out teams:


"id","user","email","team",
"1","Joe","joe@example.com","UI"
"2","John","john@example.com","UI"
"3","Susan","susan@example.com","UI"
"4","John","another_john@example.com","backspace"
"5","John","yet_another_john@example.com","backspace"

Next, copy the “Pull Requests by Repository” query from the panel:


_sourceCategory=github_logs and ( "opened" or "closed" or "reopened" )
| json "action", "issue.id", "issue.number", "issue.title" , "issue.state",
"issue.created_at", "issue.updated_at", "issue.closed_at", "issue.body",
"issue.user.login", "issue.url", "repository.name", "repository.open_issues_count"
as action, issue_ID, issue_num, issue_title, state, createdAt, updatedAt,
closedAt, body, user, url, repo_name, repoOpenIssueCnt
| count by action,repo_name
| where action != "assigned"
| transpose row repo_name column action

Then, pipe in the team identifier with a lookup command:


_sourceCategory=github_logs and ( "opened" or "closed" or "reopened" )
| json "action", "issue.id", "issue.number", "issue.title" , "issue.state",
"issue.created_at", "issue.updated_at", "issue.closed_at", "issue.body",
"issue.user.login", "issue.url", "repository.name", "repository.open_issues_count"
as action, issue_ID, issue_num, issue_title, state, createdAt, updatedAt,
closedAt, body, user, url, repo_name, repoOpenIssueCnt
| lookup team from https://toplevelurlwithlookups.com/UserTeams.csv
on user=user
| count by action,repo_name, team
| where action != "assigned"
| transpose row repo_name team column action

This resulting query tracks commits — open, closed or reopened — by team. The visualization can be controlled on the panel editor, and the lookup can be easily piped to other queries to break the pipeline by teams.

Don’t Forget User Experience

It may seem out of scope to measure user experience alongside a deployment schedule and recovery time, but it’s a release cycle health dashboard, and nothing is a better measure of a release cycle’s health than user satisfaction.

There are two standards worth including: Apdex and Net Promoter Score.

Apdex: measures application performance on a 0-1 satisfaction scale calculated by…

Apdex equation for search - sumo logic

If you want to build an Apdex solely in Sumo Logic, you could read through this blog post and use the new Metrics feature in Sumo Logic. This is a set of numeric metrics tools for performance analysis. It will allow you to set, then tune satisfaction and tolerating levels without resorting to a third party tool.

Net Promoter Score: How likely is it that you would recommend our service to a friend or colleague? This one-question survey correlates with user satisfaction, is simple to embed anywhere in an application or marketing channel, and can easily be forwarded to a Sumo Logic dashboard through a webhook. When visualizing these UX metrics, do not use the single numerical callout. Take advantage of Sumo Logic’s time-series capabilities by tracking a line chart with standard deviation. Over time, this will give you an expected range of satisfaction and visual cues of spikes in dissatisfaction that sit on the same timeline as your release cycle.

Controlling the Release Cycle Logging Deluge

A release cycle has a few dimensions that involve multiple sources, which allow you to query endlessly. For example, speed requires ticketing, CI and deployment logs. Crawling all the logs in these sources can quickly add up to TBs of data. That’s great fun for ad hoc queries, but streams like comment text are not necessary for a process health dashboard, and their verbosity can result in slow dashboard load times and costly index overruns.

To avoid this, block this and other unnecessary data by partitioning sources in Sumo Logic’s index tailoring menus. You can also speed up the dashboard by scheduling your underlying query runs for once a day. A health dashboard doesn’t send alerts, so it doesn’t need to be running in real-time.

More Resources:

Building Software Release Cycle Health Dashboards in Sumo Logic is published by the Sumo Logic DevOps Community. If you’d like to learn more or contribute, visit devops.sumologic.com. Also, be sure to check out Sumo Logic Developers for free tools and code that will enable you to monitor and troubleshoot applications from code to production.

About the Author

Alex Entrekin served on the executive staff of Cloudshare where he was primarily responsible for advanced analytics and monitoring systems. His work extending Splunk into actionable user profiling was featured at VMworld: “How a Cloud Computing Provider Reached the Holy Grail of Visibility.”

Alex is currently an attorney, researcher and writer based in Santa Barbara, CA. He holds a J.D. from the UCLA School of Law.

AWS Elastic Load Balancing: Load Balancer Best Practices

$
0
0

elb load balancer best practicesYou are probably aware that Amazon Web Services provides Elastic Load Balancing (ELB) as their preferred load balancing solution on the AWS platform. ELB distributes incoming application traffic across multiple Amazon EC2 instances in the AWS Cloud. Considering the costs involved, and the expertise required to set up your own load balancer solution, ELB can be a very attractive option for rapid deployment of your application stack.

What can often be overlooked involve these few tips and tricks to make sure you are utilizing ELB to best support your application use case and infrastructure. Following is a list of some of the top tips and best practices I’ve found helpful when helping others to set up Elastic Load Balancing.

Load Balancer Best Practices

Read the Docs!

This may seem obvious, but reading the docs and having a good fundamental understanding of how things work will save you a lot of trouble in the long run. There’s nothing like a short hands-on tutorial to get you started while conveying key features. Amazon provides very detailed documentation on how to set up and configure ELB for your environment.  A few helpful docs for ELB have been included in the references section of this article. On that note, Amazon also provides recordings of their events and talks on Youtube. These can be very helpful when trying to understand the various AWS services and how they work.

Plan your Load Balancer Installation

Thorough planning is another key practice that can often be overlooked in the rush to implement a new application stack. Take the time to understand your application requirements thoroughly so you know the expected application behavior—especially as it relates to ELB.

Be sure to factor in considerations like budget and costs, use case, scalability, availability, and disaster recovery. This can’t be stressed enough. Proper planning will mean less unforeseen issues down the road, and can also serve to provide your business with a knowledge base when others need to understand how your systems work.

SSL Termination

Along the lines of planning, if you are using SSL for your application (and you should be), plan to terminate it on the ELB. You have the option of terminating your SSL connections on your instances, or on the load balancer.

Terminating on the ELB effectively offloads the SSL processing to Amazon, saving CPU time on your instances which is better used for application processing. It can also save on costs, because you will need less instances to handle application load.

This can also save administrative overhead since ELB termination effectively moves the management to a single point in the infrastructure, rather than requiring management of the SSL certs on multiple servers.

Unless your security requirements dictate otherwise, this can make your life quite a bit simpler.

Configure Cross-Zone Load Balancing

Don’t just place all of your instances into one availability zone inside of an AWS region, and call it a day. When mapping out your infrastructure, plan on placing your instances into multiple AZs to take advantage of cross-zone load balancing.

This can help with application availability and resiliency, and can also make your maintenance cycles easier as you can take an entire availability zone offline at a time to perform your maintenance, then add it back to the load balancer, and repeat with the remaining availability zones.

It’s worth noting that ELB does not currently support cross-region load balancing, so you’ll need to find another way to support multiple regions. One way of doing that is to implement global load balancing.

Global Load Balancing

AWS has a feature in Route 53 called routing policies. With routing policies, you can direct global traffic in a variety of ways, but more specifically direct client traffic to whichever data center is most appropriate for your client and application stack.

This is a fairly advanced topic, with a lot of ins and outs that can’t be covered in this article. See my post, Global Load Balancing Using AWS Route 53, for more details. In short, the best way to learn about this feature in Route 53 is probably to start with the docs, then try implementing it through the use of Route 53 traffic flow.

Pre-warming your ELB

Are you expecting a large spike in traffic for an event? Get in touch with Amazon and have them pre-warm your load balancers. ELBs scale best with a gradual increase in traffic load. They do not respond well to spiky loads, and can break if too much flash traffic is directed their way.

This is covered under the ELB best practices, and can be critical to having your event traffic handled gracefully, or being left wondering what just happened to your application stack when there is a sudden drop in traffic. Key pieces of information to relay to Amazon when contacting them are the total number of expected requests, and the average request response size.

One other key piece of information has to do with operating at scale. If you are terminating your SSL on the ELB, and the HTTPS request response size is small, be sure to stress that point with Amazon support. Small request responses coupled with SSL termination on the ELB may result in overloading the ELBs, even though Amazon will have scaled them to meet your anticipated demand.

Monitoring

One final item, but a very important one. Be sure and monitor your ELBs. This can be done through the AWS dashboard, and can provide a great deal of insight into application behavior, and identifying problems that may arise. You can also use the Sumo Logic App for Elastic Load Balancing for greater visibility into events that, in turn, help you understand the overall health of your EC2 deployment. For example, you can use the Sumo Logic App to analyze raw Elastic Load Balancing data to investigate the availability of applications running behind Elastic Load Balancers.

Conclusion

In this article, we’ve covered best practices for Amazon Elastic Load Balancing, including documentation, planning, SSL termination, regional and global load balancing, ELB pre-warming, and monitoring. Hopefully, these tips and tricks will help you to better plan and manage your AWS ELB deployment.

AWS Elastic Load Balancing: Load Balancer Best Practices is published by the Sumo Logic DevOps Community. If you’d like to learn more or contribute, visit devops.sumologic.com. Also, be sure to check out Sumo Logic Developers for free tools and code that will enable you to monitor and troubleshoot applications from code to production.

References

About the Author

Steve Tidwell has been working in the tech industry for over two decades, and has done everything from end-user support to scaling a global data ingestion and analysis platform to handle data analysis for some of the largest streaming events on the Web. He is currently Lead Architect for a well-known tech news site, where he plots to take over the world with cloud- based technologies from his corner of the office.

A Beginner’s Guide to GitHub Events

$
0
0

Github events - Sumo Logic DevOpsDo you like GitHub, but don’t like having to log in to check on the status of your project or code? GitHub events are your solution.

GitHub events provide a handy way to receive automated status updates from your GitHub repos concerning everything from code commits to new users joining a project. And because they are accessible via a Web API as GET requests, it’s easy to integrate them into the notification system of your choosing.

Keep reading for a primer on GitHub events and how to get the most out of them.

What GitHub events are, and what they are not

Again, GitHub events provide an easy way to keep track of your GitHub repository without monitoring its status manually. They’re basically a notification system that offers a high level of customizability.

You should keep in mind, however, that GitHub events are designed only as a way to receive notifications. They don’t allow you to interact with your GitHub repo. You can’t trigger events; you can only receive notifications when specific events occur.

That means that events are not a way for you to automate the maintenance of your repository or project. You’ll need other tools for that. But if you just want to monitor changes, they’re a simple solution.

How to use GitHub events

GitHub event usage is pretty straightforward. You simply send GET requests to https://api.github.com. You specify the type of information you want by completing the URL information accordingly.

For example, if you want information about the public events performed by a given GitHub user, you would send a GET request to this URL:

https://api.github.com/users//events

(If you are authenticated, this request will generate information about private events that you have performed.)

Here’s a real-world example, in which we send a GET request using curl to find information about public events performed by Linus Torvalds (the original author of Git), whose username is torvalds:

curl -i -H "Accept: application/json" -H "Content-Type: application/json" -X GET https://api.github.com/users/torvalds/events

Another handy request lets you list events for a particular organization. The URL to use here looks like:

https://api.github.com/users/:username/events/orgs/

The full list of events, with their associated URLs, is available from the GitHub documentation.

Use GitHub Webhooks for automated events reporting

So far, we’ve covered how to request information about an event using a specific HTTP request. But you can take things further by using GitHub Webhooks to automate reporting about events of a certain type.

Webhooks allow you to “subscribe” to particular events and receive an HTTP POST response (or, in GitHub parlance, a “payload”) to a URL of your choosing whenever that event occurs. You can create a Webhook in the GitHub Web interface that allows you to specify the URL to which GitHub should send your payload when an event is triggered.

Alternatively, you can create Webhooks via the GitHub API using POST requests.

However you set them up, Webhooks allow you to monitor your repositories (or any public repositories) and receive alerts in an automated fashion.

Like most good things in life, Webhooks are subject to certain limitations, which are worth noting. Specifically, you can only configure up to a maximum of twenty events per each GitHub organization or repository.

Authentication and GitHub events

The last bit of information we should go over is how to authenticate with the GitHub API. While you can monitor public events without authentication, you’ll need to authenticate in order to keep track of private ones.

Authentication via the GitHub API is detailed here, but it basically boils down to having three options. The simplest is to do HTTP authentication using a command like:

curl -u "username" https://api.github.com

If you want to be more sophisticated, you can also authenticate using OAuth2 via either key/secrets or tokens. For example, authenticating with a token would look something like:

curl https://api.github.com/?access_token=OAUTH-TOKEN

If you’re monitoring private events, you’ll want to authenticate with one of these methods before sending requests about the events.

Further reading

If you want to dive deeper into the details of GitHub events, the following resources are useful:

A Beginner’s Guide to GitHub Events is published by the Sumo Logic DevOps Community. If you’d like to learn more or contribute, visit devops.sumologic.com. Also, be sure to check out Sumo Logic Developers for free tools and code that will enable you to monitor and troubleshoot applications from code to production.


Solaris Containers: What You Need to Know

$
0
0

Solaris ContainerSolaris and containers may not seem like two words that go together—at least not in this decade. For the past several years, the container conversation has been all about platforms like Docker, CoreOS and LXD running on Linux (and, in the case of Docker, now Windows and Mac OS X, too).

But Solaris, Oracle’s Unix-like OS, has actually had containers for a long time. In fact, they go all the way back to the release of Solaris 10 in 2005 (technically, they were available in the beta version of Solaris 10 starting in 2004), long before anyone was talking about Linux containers for production purposes. And they’re still a useful part of the current version of the OS, Solaris 11.3.

Despite the name similarities, Solaris containers are hardly identical to Docker or CoreOS containers. But they do similar things by allowing you to virtualize software inside isolated environments without the overhead of a traditional hypervisor.

Even as Docker and the like take off as the container solutions of choice for Linux environments, Solaris containers are worth knowing about, too—especially if you’re the type of developer or admin who finds himself, against his will, stuck in the world of proprietary, commercial Unix-like platforms because some decision-maker in his company’s executive suite is still wary of going wholly open source….

Plus, as I note below, Oracle now says it is working to bring Docker to Solaris containers—which means containers on Solaris could soon integrate into the mainstream container and DevOps scene.

Below, I’ll outline how Solaris containers work, what makes them different from Linux container solutions like Docker, and why you might want to use containers in a Solaris environment.

The Basics of Solaris Containers

Let’s start by defining the basic Solaris container architecture and terminology.

On Solaris, each container lives within what Oracle calls a local zone. Local zones are software-defined boundaries to which specific storage, networking and/or CPU resources are assigned. The local zones are strictly isolated from one another in order to mitigate security risks and ensure that no zone interferes with the operations of another.

Each Solaris system also has a global zone. This consists of the host system’s resources. The global zone controls the local zones (although a global zone can exist even if no local zones are defined). It’s the basis from which you configure and assign resources to local zones.

Each zone on the system, whether global or local, gets a unique name (the name of the global zone is always “global”—boring, I know, but also predictable) and a unique numerical identifier.

So far, this probably sounds a lot like Docker, and it is. Local zones on Solaris are like Docker containers, while the Solaris global zone is like the Docker engine itself.

Working with Zones and Containers on Solaris

The similarities largely end there, however, at least when it comes to the ways in which you work with containers on Solaris.

On Docker or CoreOS, you would use a tool like Swarm or Kubernetes to manage your containers. On Solaris, you use Oracle’s Enterprise Manager Ops Center to set up local zones and define which resources are available to them.

Once you set up a zone, you can configure it to your liking (for the details, check out Oracle’s documentation), then run software inside the zones.

One particularly cool thing that Solaris containers let you do is migrate a physical Solaris system into a zone. You can also migrate zones between host machines. So, yes, Solaris containers can come in handy if you have a cluster environment, even though they weren’t designed for native clustering in the same way as Docker and similar software.

Solaris Containers vs. Docker/CoreOS/LXD: Pros and Cons

By now, you’re probably sensing that Solaris containers work differently in many respects from Linux containers. You’re right.

In some ways, the differences make Solaris a better virtualization solution. In others, the opposite is true. Mostly, though, the distinction depends on what is most important to you.

Solaris’s chief advantages include:

  • Easy configuration: As long as you can point and click your way through Enterprise Manager Ops Center, you can manage Solaris containers. There’s no need to learn something like the Docker CLI.
  • Easy management of virtual resources: On Docker and CoreOS, sharing storage or networking with containerized apps via tools like Docker Data Volumes can be tedious. On Solaris it’s more straightforward (largely because you’re splicing up the host resources of only a single system, not a cluster).

But there are also drawbacks, which mostly reflect the fact that Solaris containers debuted more than a decade ago, well before people were talking about the cloud and hyper-scalable infrastructure.

Solaris container cons include:

  • Solaris container management doesn’t scale well. With Enterprise Manager Ops Center, you can only manage as many zones as you can handle manually.
  • You can’t spin up containers quickly based on app images, as you would with Docker or CoreOS, at least for now. This makes Solaris containers impractical for continuous delivery scenarios. But Oracle says it is working to change that by promising to integrate Docker with Solaris zones. So far, though, it’s unclear when that technology will arrive in Solaris.
  • There’s not much choice when it comes to management. Unlike the Linux container world, where you can choose from dozens of container orchestration and monitoring tools, Solaris only gives you Oracle solutions.

The bottom line: Solaris containers are not as flexible or nimble as Linux containers, but they’re relatively easy to work with. And they offer powerful features, especially when you consider how old they are. If you work with Oracle data centers, Solaris containers are worth checking out, despite being a virtualization solution that gets very little press these days.

Solaris Containers: What You Need to Know is published by the Sumo Logic DevOps Community. If you’d like to learn more or contribute, visit devops.sumologic.com. Also, be sure to check out Sumo Logic Developers for free tools and code that will enable you to monitor and troubleshoot applications from code to production.

About the Author

Chris Tozzi has worked as a journalist and Linux systems administrator. He has particular interests in open source, agile infrastructure and networking. He is Senior Editor of content and a DevOps Analyst at Fixate IO.

Benchmarking Microservices for Fun and Profit

$
0
0

Charts on WallWhy should I benchmark microservices?

The ultimate goal of benchmarking is to better understand the software, and test out the effects of various optimization techniques for microservices. In this blog, we describe our approach to benchmarking microservices here at Sumo Logic.

Create a spreadsheet for tracking your benchmarking

We found a convenient way to document a series of benchmarks is in a Google Spreadsheet. It allows collaboration and provides the necessary features to analyze and sum up your results. Structure your spreadsheet as follows:

  • Title page
    • Goals
    • Methodology
    • List of planned and completed experiments (evolving as you learn more)
    • Insights
  • Additional pages
    • Detailed benchmark results for various experiments

Be clear about your benchmark goals

Before you engage in benchmarking, clearly state (and document) your goal. Examples of goals are:

“I am trying to understand how input X affects metric Y”

“I am running experiments A, B and C to increase/decrease metric X”

Pick one key metric (Key Performance Indicator – KPI)

State clearly which one metric you are concerned about and how the metric affects users of the system. If you choose to capture additional metrics for your test runs, ensure that the key metrics stands out.

Think like a scientist

You’re going to be performing a series of experiments to better understand which inputs affect your key metric, and how. Consider and document the variables you devise, and create a standard control set to compare against. Design your series of experiments in a fashion that leads to the understanding in the least amount of time and effort.

Define, document and validate your benchmarking methodology

Define a methodology for running your benchmarks. It is critical your benchmarks be:

  • Fairly fast (several minutes, ideally)
  • Reproducible in the exact same manner, even months later
  • Documented well enough so another person can repeat them and get identical results

Document your methodology in detail. Also document how to re-create your environment. Include all details another person needs to know:

  • Versions used
  • Feature flags and other configuration
  • Instance types and any other environmental details

Use load generation tools, and understand their limitations

In most cases, to accomplish repeatable, rapid-fire experiments, you need a synthetic load generation tool. Find out whether one already exists. If not, you may need to write one.

Understand that load generation tools are at best an approximation of what is going on in production. The better the approximation, the more relevant the results you’re going to obtain. If you find yourself drawing insights from benchmarks that do not translate into production, revisit your load generation tool.

Validate your benchmarking methodology

Repeat a baseline benchmark at least 10 times and calculate the standard deviation over the results. You can use the following spreadsheet formula:

=STDEV(<range>)/AVERAGE(<range>)

Format this number as a percentage, and you’ll see how big the relative variance in your result set is. Ideally, you want this value to be < 10%. If your benchmarks have larger variance, revisit your methodology. You may need to tweak factors like:

  • Increase the duration of the tests.
  • Eliminate variance from the environments.
    • Ensure all benchmarks start in the same state (i.e. cold caches, freshly launched JVMs, etc).
    • Consider the effects of Hotspot/JITs.
  • Simplify/stub components and dependencies on other microservices that add variance but aren’t key to your benchmark.
    • Don’t be shy to make hacky code changes and push binaries you’d never ship to production.

Important: Determine the number of results you need to get the standard deviation below a good threshold. Run each of your actual benchmarks at least that many times. Otherwise, your results may be too random.

Execute the benchmark series

Now that you have developed a sound methodology, it’s time to gather data. Tips:

  • Only vary one input/knob/configuration setting at a time.
  • For every run of the benchmark, capture start and end time. This will help you correlate it to logs and metrics later.
  • If you’re unsure whether the input will actually affect your metric, try extreme values to confirm it’s worth running a series.
  • Script the execution of the benchmarks and collection of metrics.
  • Interleave your benchmarks to make sure what you’re observing aren’t slow changes in your test environment. Instead of running AAAABBBBCCCC, run ABCABCABCABC.

 Create enough load to be able to measure a difference

There are two different strategies for generating load.

Strategy 1: Redline it!

In most cases, you want to ensure you’re creating enough load to saturate your component. If you do not manage to accomplish that, how would you see that you increased it’s throughput?

If your component falls apart at redline (i.e. OOMs, throughput drops, or otherwise spirals out of control), understand why, and fix the problem.

Strategy 2: Measure machine resources

In cases where you cannot redline the component, or you have reason to believe it behaves substantially different in less-than-100%-load situations, you may need to resort to OS metrics such as CPU utilization and IOPS to determine whether you’ve made a change.

Make sure your load is large enough for changes to be visible. If your load causes 3% CPU utilization, a 50% improvement in performance will be lost in the noise.

Try different amounts of load and find a sweet spot, where your OS metric measurement is sensitive enough.

Add new benchmarking experiments as needed

As you execute your benchmarks and develop a better understanding of the system, you are likely to discover new factors that may impact your key metric. Add new experiments to your list and prioritize them over the previous ones if needed.

Hack the code

In some instances, the code may not have configuration or control knobs for the inputs you want to vary. Find the fastest way to change the input, even if it means hacking the code, commenting out sections or otherwise manipulating the code in ways that wouldn’t be “kosher” for merges into master. Remember: The goal here is to get answers as quickly as possible, not to write production-quality code—that comes later, once we have our answers.

Analyze the data and document your insights

Once you’ve completed a series of benchmarks, take a step back and think about what the data is telling you about the system you’re benchmarking. Document your insights and how the data backs them up.

It may be helpful to:

    • Calculate the average for each series of benchmarks you ran and to use that to calculate the difference (in percent) between series — i.e. “when I doubled the number of threads, QPS increased by 23% on average.”
    • Graph your results — is the relationship between your input and the performance metric linear? Logarithmic? Bell curve?

Present your insights

  1. When presenting your insights to management and/or other engineering teams, apply the Pyramid Principle. Engineers often make the mistake of explaining methodology, results and concluding with the insights. It is preferable to reverse the order and start with the insight. Then, if needed/requested, explain methodology and how the data supports your insight.
  2. Omit nitty-gritty details of any experiments that didn’t lead to interesting insights.
  3. Avoid jargon, and if you cannot, explain it. Don’t assume your audience knows the jargon.
  4. Make sure your graphs have meaningful, human-readable units.
  5. Make sure your graphs can be read when projected onto a screen or TV.

How Hudl and Cloud Cruiser use Sumo Logic Unified Logs and Metrics

$
0
0

We launched the Sumo Logic Unified Logs and Metrics (ULM) solution a couple of weeks ago, and we already are seeing massive success and adoption of this solution. So how are how real-world customers using the Sumo Logic ULM product?

Today, we ran a webinar with a couple of our early ULM product customers and got an inside view into their processes, team makeup, and how ULM is changing the way they monitor and troubleshoot. The webinar was hosted by Ben Newton, Sumo Logic Product Manager extraordinaire for ULM, and featured two outstanding customer speakers: Ben Abrams, Lead DevOps Engineer, Cloud Cruiser, and Jon Dokulil, VP of Engineering, Hudl.

Ben and Jon both manage mission-critical AWS-based applications for their organizations andare tasked with ensuring excellent customer experience. Needless to say, they know application and infrastructure operations well.

In the webinar, Ben and Jon described their current approaches to operations (paraphrased below for readability and brevity):

Jon: Sumo Logic log analytics is a critical part of the day to day operations at Hudl. Hudl engineers use Sumo Dashboards to identify issues when they deploy apps; they also use Sumo Logic reports extensively to troubleshoot application and infrastructure performance issues.

Ben: Everything in our world starts with an alert. And before ULM, we had to use many  systems to correlate the data. We use Sumo Logic extensively in the troubleshooting process.

Ben and Jon also described their reasons to consider Sumo Logic ULM:

Ben: Both logs and metrics tell critical parts of the machine data story and we want to see them together in one single pane of glass so that we can correlate the data better and faster and reduce our troubleshooting time. Sumo Logic ULM provides this view to us.

Jon: We have many tools serving the DevOps team, and the team needs to check many systems when things go wrong and not all team members are skilled in all tools. Having a single tool that can help diagnose problems is better, so consolidating across logs and metrics has provided us significant value.

Hudl

ULM Dashboards at Hudl

Finally, the duo explains where they want to go with Sumo Logic ULM:

Ben: We would like to kill off our siloed metrics solution. We would also like use AWS auto-scale policies to automate the remediation process, without human intervention.

Jon: We would like to provide full log and metrics visibility with the IT alerts so that the DevOps team can get full context and visibility to fix issues quickly.

All in all, this was a fantastic discussion and it validates why IT shops that are tasked with 100% performance SLA’s should consider Sumo Logic Unified Logs and Metrics solution. To hear the full story, check out the full webinar on-demand.
If you are interested in trying out Sumo Logic ULM solution, sign up for Sumo Logic Free.

Tutorial: How to Run Artifactory as a Container

$
0
0

If you use Artifactory, JFrog’s artifact repository manager, there’s a good chance you’re already invested in a DevOps-inspired workflow. And if you do DevOps, you’re probably interested in containerizing your apps and deploying them through Docker or another container system. That’s a key part of being agile, after all.

From this perspective, it only makes sense to want to run Artifactory as a Docker container. Fortunately, you can do that easily enough. While Artifactory is available for installation directly on Linux or Windows systems, it can also run easily enough on Docker. In fact, running Artifactory as a container gives you some handy features that would not otherwise be available.

In this tutorial, I’ll explain how to run Artifactory as a container, and discuss some of the advantages of running it this way.

Pulling the Artifactory Container

Part of the reason why running Artifactory as a Docker container is convenient is that pre-built images for it already exist. The images come with the Nginx Web server and Docker repositories built in.

The Artifactory container images are available from Bintray. You can pull them with a simple Docker pull command, like so:

docker pull docker.bintray.io/jfrog/artifactory-oss:latest

This would pull the image for the latest version of the open source edition of Artifactory. If you want a different version, you can specify that in the command. Images are also available for the Pro Registry and Pro versions of Artifactory.

Running Artifactory as a Container

Once you’ve pulled the container image, start it up. A command like this one would do the trick:


docker run -d --name artifactory -p 80:80 -p 8081:8081 -p 443:443 \
-v $ARTIFACTORY_HOME/data \
-v $ARTIFACTORY_HOME/logs \
-v $ARTIFACTORY_HOME/backup \
-v $ARTIFACTORY_HOME/etc \
docker.bintray.io/jfrog/artifactory-oss:latest

The -v flags specify volume mounts to use. You could use whichever volume mounts you like, but the ones specified above follow JFrog’s suggestions. To configure them correctly, you should run


export ARTIFACTORY_HOME=/var/opt/jfrog/artifactory

prior to starting the Artifactory container, so that the ARTIFACTORY_HOME environment variable is set correctly.

Configuring the Client

Artifactory is now up and running as a container. But there’s a little extra tweaking you need to do to make it accessible on your local machine.

In particular, edit /etc/hosts so that it includes this line:

localhost docker-virtual.art.local docker-dev-local2.art.local docker-prod-local2.art.local

Also run:

DOCKER_OPTS="$DOCKER_OPTS --insecure-registry \ docker-virtual.art.local --insecure-registry \
docker-dev-local2.art.local --insecure-registry \
docker-prod-local2.art.local --insecure-registry \
docker-remote.art.local"

This command tells Docker to work with a self-signed certificate. It’s necessary because the Artifactory container image has a self-signed certificate built in. (You would want to change this if you were running Artifactory in production, of course.)

After this, restart Docker and you’re all set. Artifactory is now properly configured, and accessible from your browser at http://localhost:8081/artifactory.

Why run Artifactory as a Container?

Before wrapping up the tutorial, let’s go over why you might want to run Artifactory as a container in the first place. Consider the following benefits:

  • It’s easy to install. You don’t have to worry about configuring repositories or making your Linux distribution compatible with the Artifactory packages. You can simply install Docker, then run the Artifactory package.
  • It’s easy to get a particular version. Using RPM or Debian packages, pulling a particular version of an app (and making sure the package manager doesn’t automatically try to update it) can be tricky. With the container image, it’s easy to choose whichever version you want.
  • It’s more secure and isolated. Rather than installing Artifactory to your local file system, you keep everything inside a container. That makes removing or upgrading clean and easy.
  • It’s easy to add to a cluster. If you want to make Artifactory part of a container cluster and manage it with Kubernetes or Swarm, you can do that in a straightforward way by running it as a container.

How to Run Artifactory as a Container is published by the Sumo Logic DevOps Community. If you’d like to learn more or contribute, visit devops.sumologic.com. Also, be sure to check out Sumo Logic Developers for free tools and code that will enable you to monitor and troubleshoot applications from code to production.

About the Author

Chris tozzi on npm artifactoryChris Tozzi has worked as a journalist and Linux systems administrator. He has particular interests in open source, agile infrastructure and networking. He is Senior Editor of content and a DevOps Analyst at Fixate IO.

5 Bintray Security Best Practices

$
0
0

Bintray, JFrog’s software hosting and distribution platform, offers lots of exciting features, like CI integration and REST APIs.

If you’re like me, you enjoy thinking about those features much more than you enjoy thinking about software security. Packaging and distributing software is fun; worrying about the details of Bintray security configurations and access control for your software tends to be tedious (unless security is your thing, of course).

Like any other tool, however, Bintray is only effective in a production environment when it is run securely. That means that, alongside all of the other fun things you can do with Bintray, you should plan and run your deployment in a way that mitigates the risk of unauthorized access, the exposure of private data, and so on.

Below, I explain the basics of Bintray security, and outline strategies for making your Bintray deployment more secure.

Bintray Security Basics

Bintray is a cloud service hosted by JFrog’s data center provider. JFrog promises that the service is designed for security, and hardened against attack. (The company is not very specific about how it mitigates security vulnerabilities for Bintray hosting, but I wouldn’t be either, since one does not want to give potential attackers information about the configuration.) JFrog also says that it restricts employee access to Bintray servers and uses SSH over VPN when employees do access the servers, which adds additional security.

The hosted nature of Bintray means that none of the security considerations associated with on-premises software apply. That makes life considerably easier from the get-go if you’re using Bintray and are worried about security.

Still, there’s more that you can do to ensure that your Bintray deployment is as robust as possible against potential intrusions. In particular, consider adopting the following policies.

Set up an API key for Bintray

Bintray requires users to create a username and password when they first set up an account. You’ll need those when getting started with Bintray.

Once your account is created, however, you can help mitigate the risk of unauthorized access by creating an API key. This allows you to authenticate over the Bintray API without using your username or password. That means that even if a network sniffer is listening to your traffic, your account won’t be compromised.

Use OAuth for Bintray Authentication

Bintray also supports authentication using the OAuth protocol. That means you can log in using credentials from a GitHub, Twitter or Google+ account.

Chances are that you pay closer attention to one of these accounts (and get notices from the providers about unauthorized access) than you do to your Bintray account. So, to maximize security and reduce the risk of unauthorized access, make sure your Bintray account itself has login credentials that cannot be brute-forced, then log in to Bintray via OAuth using an account from a third-party service that you monitor closely.

Sign Packages with GPG

Bintray supports optional GPG signing of packages. To do this, you first have to configure a key pair in your Bintray profile. For details, check out the Bintray documentation.

GPG signing is another obvious way to help keep your Bintray deployment more secure. It also keeps the users of your software distributions happier, since they will know that your packages are GPG-signed, and therefore, are less likely to contain malicious content.

Take Advantage of Bintray’s Access Control

The professional version of Bintray offers granular control over who can download packages. (Unfortunately this feature is only available in that edition.) You can configure access on a per-user or per-organization basis.

While gaining Bintray security shouldn’t be the main reason you use granular access control (the feature is primarily designed to help you fine-tune your software distribution), it doesn’t hurt to take advantage of it in order to reduce the risk that certain software becomes available to a user to whom you don’t want to give access.

5 Bintray Security Best Practices is published by the Sumo Logic DevOps Community. If you’d like to learn more or contribute, visit devops.sumologic.com. Also, be sure to check out Sumo Logic Developers for free tools and code that will enable you to monitor and troubleshoot applications from code to production.

About the Author

Chris Tozzi has worked as a journalist and Linux systems administrator. He has particular interests in open source, agile infrastructure and networking. He is Senior Editor of content and a DevOps Analyst at Fixate IO.

Getting Started with AWS Kinesis Streams

$
0
0

Sumo Logic Kinesis ConnectorIn December 2013, Amazon Web Services released Kinesis, a managed, dynamically scalable service for the processing of streaming big data in real-time. Since that time, Amazon has been steadily expanding the regions in which Kinesis is available, and as of this writing, it is possible to integrate Amazon’s Kinesis producer and client libraries into a variety of custom applications to enable real-time processing of streaming data from a variety of sources.

Kinesis acts as a highly available conduit to stream messages between data producers and data consumers. Data producers can be almost any source of data: system or web log data, social network data, financial trading information, geospatial data, mobile app data, or telemetry from connected IoT devices. Data consumers will typically fall into the category of data processing and storage applications such as Apache Hadoop, Apache Storm, and Amazon Simple Storage Service (S3) and ElasticSearch.

Understanding Key Concepts in Kinesis

It is helpful to understand some key concepts when working with Kinesis Streams.

Kinesis Stream Shards

The basic unit of scale when working with streams is a shard. A single shard is capable of ingesting up to 1MB or 1,000 PUTs per second of streaming data, and emitting data at a rate of 2MB per second.

Shards scale linearly, so adding shards to a stream will add 1MB per second of ingestion, and emit data at a rate of 2MB per second for every shard added. Ten shards will scale a stream to handle 10MB (10,000 PUTs) of ingress, and 20MB of data egress per second. You choose the number of shards when creating a stream, and it is not possible to change this via the AWS Console once you’ve created a stream.

It is possible to dynamically add or remove shards from a stream using the AWS Streams API. This is called resharding. Resharding cannot be done via the AWS Console, and is considered an advanced strategy when working with Kinesis. A solid understanding of the subject is required prior to attempting these operations.

Adding shards essentially splits shards in order to scale the stream, and removing shards merges them. Data is not discarded when adding (splitting) or removing (merging) shards. It is not possible to split a single shard into more than two, nor to merge more than two shards into a single shard at a time.

Adding and removing shards will increase or decrease the cost of your stream accordingly. Per the Amazon Kinesis Streams FAQ, there is a default limit of 10 shards per region. This limit can be increased by contacting Amazon Support and requesting a limit increase. There is no limit to the number of shards or streams in an account.

Types of Shards

Records are units of data stored in a stream and are made up of a sequence number, partition key, and a data blob. Data blobs are the payload of data contained within a record. The maximum size of a data blob before Base64-encoding is 1MB, and is the upper limit of data that can be placed into a stream in a single record. Larger data blobs must be broken into smaller chunks before putting them into a Kinesis stream.

Partition keys are used to identify different shards in a stream, and allow a data producer to distribute data across shards.

Sequence numbers are unique identifiers for records inserted into a shard. They increase monotonically, and are specific to individual shards.

Amazon Kinesis Offerings

Amazon Kinesis is currently broken into three separate service offerings.

Kinesis Streams is capable of capturing large amounts of data (terabytes per hour) from data producers, and streaming it into custom applications for data processing and analysis. Streaming data is replicated by Kinesis across three separate availability zones within AWS to ensure reliability and availability of your data.

Kinesis Streams is capable of scaling from a single megabyte up to terabytes per hour of streaming data. You must manually provision the appropriate number of shards for your stream to handle the volume of data you expect to process. Amazon helpfully provides a shard calculator when creating a stream to correctly determine this number. Once created, it is possible to dynamically scale up or down the number of shards to meet demand, but only with the AWS Streams API at this time.

It is possible to load data into Streams using a number of methods, including HTTPS, the Kinesis Producer Library, the Kinesis Client Library, and the Kinesis Agent.

By default, data is available in a stream for 24 hours, but can be made available for up to 168 hours (7 days) for an additional charge.

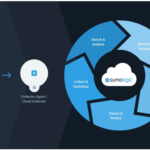
Monitoring is available through Amazon Cloudwatch. If you want to add more verbose visualizations of that data, you can use Sumo Logic’s open source Kinesis Connector to fetch data from the Kinesis Stream and send it to the Sumo Logic service. Kinesis Connector is a Java connector that acts as a pipeline between an [Amazon Kinesis] stream and a [Sumologic] Collection. Data gets fetched from the Kinesis Stream, transformed into a POJO and then sent to the Sumologic Collection as JSON.

Kinesis Firehose is Amazon’s data-ingestion product offering for Kinesis. It is used to capture and load streaming data into other Amazon services such as S3 and Redshift. From there, you can load the streams into data processing and analysis tools like Elastic Map Reduce, and Amazon Elasticsearch Service. It is also possible to load the same data into S3 and Redshift at the same time using Firehose.

Firehose can scale to gigabytes of streaming data per second, and allows for batching, encrypting and compressing of data. It should be noted that Firehose will automatically scale to meet demand, which is in contrast to Kinesis Streams, for which you must manually provision enough capacity to meet anticipated needs.

As with Kinesis Streams, it is possible to load data into Firehose using a number of methods, including HTTPS, the Kinesis Producer Library, the Kinesis Client Library, and the Kinesis Agent. Currently, it is only possible to stream data via Firehose to S3 and Redshift, but once stored in one of these services, the data can be copied to other services for further processing and analysis.

Monitoring is available through Amazon Cloudwatch.

Kinesis Analytics is Amazon’s forthcoming product offering that will allow running of standard SQL queries against data streams, and send that data to analytics tools for monitoring and alerting.

This product has not yet been released, and Amazon has not published details of the service as of this date.

Kinesis Pricing

Here’s a pricing guide for the various Kinesis offerings.

Kinesis Streams

There are no setup or minimum costs associated with using Amazon Kinesis Streams. Pricing is based on two factors — shard hours, and PUT Payload Units, and will vary by region. US East (Virginia), and US West (Oregon) are the least expensive, while regions outside the US can be significantly more expensive depending on region.

At present, shard hours in the US East (Virginia) region are billed at $0.015 per hour, per shard. If you have 10 shards, you would be billed at a rate of $0.15 per hour.

PUT Payload Units are counted in 25KB chunks. If a record is 50KB, then you would be billed for two units. If a record is 15KB, you will be billed for a single unit. Billing per 1 million units in the US East (Virginia) region is $0.014.

Extended Data Retention for up to 7 days in the US East (Virginia) region is billed at $0.020 per shard hour. By default, Amazon Kinesis stores your data for 24 hours. You must enable Extended Data Retention via the Amazon API.

Kinesis Streams is not available in the AWS Free Tier. For more information and pricing examples, see Amazon Kinesis Streams Pricing.

Kinesis Firehose

There are also no setup or minimum costs associated with using Amazon Kinesis Firehose. Pricing is based on a single factor — data ingested per GB. Data ingested by Firehose in the US East (Virginia) region is billed at $0.035 per GB.

You will also be charged separately for data ingested by Firehose and stored in S3 or Redshift. Kinesis Firehose is not available in the AWS Free Tier. For more information and pricing examples, see Amazon Kinesis Firehose Pricing.

Kinesis vs SQS

Amazon Kinesis is differentiated from Amazon’s Simple Queue Service (SQS) in that Kinesis is used to enable real-time processing of streaming big data. SQS, on the other hand, is used as a message queue to store messages transmitted between distributed application components.

Kinesis provides routing of records using a given key, ordering of records, the ability for multiple clients to read messages from the same stream concurrently, replay of messages up to as long as seven days in the past, and the ability for a client to consume records at a later time. Kinesis Streams will not dynamically scale in response to increased demand, so you must provision enough streams ahead of time to meet the anticipated demand of both your data producers and data consumers.

SQS provides for messaging semantics so that your application can track the successful completion of work items in a queue, and you can schedule a delay in messages of up to 15 minutes. Unlike Kinesis Streams, SQS will scale automatically to meet application demand. SQS has lower limits to the number of messages that can be read or written at one time compared to Kinesis, so applications using Kinesis can work with messages in larger batches than when using SQS.

Competitors to Kinesis

There are a number of products and services that provide similar feature sets to Kinesis. Three well-known options are summarized below.

Apache Kafka is a high performance message broker originally developed by LinkedIn, and now a part of the Apache Software Foundation. It is downloadable software written in Scala. There are quite a few opinions as to whether one should choose Kafka or Kinesis, but there are some simple use cases to help make that decision.

If you are looking for an on-prem solution, consider Kafka since you can set up and manage it yourself. Kafka is generally considered more feature-rich and higher- performance than Kinesis, and offers the flexibility that comes with maintaining your own software. On the other hand, you must set up and maintain your own Kafka cluster(s), and this can require expertise that you may not have available in-house.

It is possible to set up Kafka on EC2 instances, but again, that will require someone with Kafka expertise to configure and maintain. If your use case requires a turnkey service that is easy to set up and maintain, or integrate with other AWS services such as S3 or Redshift, then you should consider Kinesis instead.

There are a number of comparisons on the web that go into more detail about features, performance, and limitations if you’re inclined to look further.

Microsoft Azure Event Hubs is Microsoft’s entry in the streaming messaging space. Event Hubs is a managed service offering similar to Kinesis. It supports AMQP 1.0 in addition to HTTPS for reading and writing of messages. Currently, Kinesis only supports HTTPS and not AMQP 1.0. (There is an excellent comparison of Azure Event Hubs vs Amazon Kinesis if you are looking to see a side-by-side comparison of the two services.)

Google Cloud Pub/Sub is Google’s offering in this space. Pub/Sub supports both HTTP access, as well as gRPC (alpha) to read and write streaming data.

At the moment, adequate comparisons of this service to Amazon Kinesis (or Azure Event Hubs) are somewhat lacking on the web. This is expected; Google only released version 1 of this product in June of 2015. Expect to see more sometime in the near future.

Google provides excellent documentation on using the service in their Getting Started guide.
Beginner Resources for Kinesis

Amazon has published an excellent tutorial on getting started with Kinesis in their blog post Building a Near Real-Time Discovery Platform with AWS. It is recommended that you give this a try first to see how Kinesis can integrate with other AWS services, especially S3, Lambda, Elasticsearch, and Kibana.

Once you’ve taken Kinesis for a test spin, you might consider integrating with an external service such as SumoLogic to analyze log files from your EC2 instances using their Amazon Kinesis Connector. (The code has been published in the SumoLogic Github repository.)

Getting Started with AWS Kinesis Streams is published by the Sumo Logic DevOps Community. If you’d like to learn more or contribute, visit devops.sumologic.com. Also, be sure to check out Sumo Logic Developers for free tools and code that will enable you to monitor and troubleshoot applications from code to production.

About the Author

Steve Tidwell has been working in the tech industry for over two decades, and has done everything from end-user support to scaling a global data ingestion and analysis platform to handle data analysis for some of the largest streaming events on the Web. He is currently Lead Architect for a well-known tech news site, where he plots to take over the world with cloud based technologies from his corner of the office.

Resources

Integrating Apps with the Sumo Logic Search API

$
0
0

Sumo Logic Search Job API
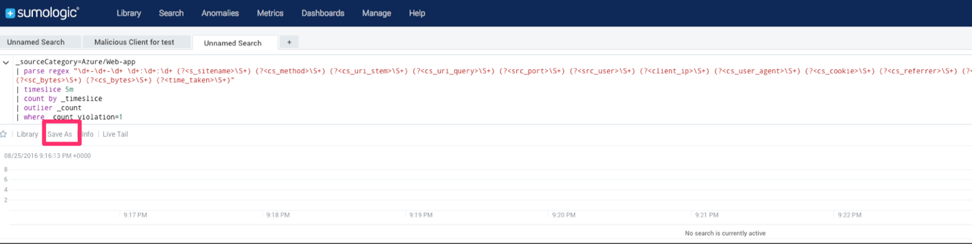
The Sumo Logic Web app provides a search interface that lets you parse logs. This provides a great resource for a lot of use cases — especially because you can take advantage of a rich search syntax, including wildcards and various operators (documented here), directly from the Web app.

But we realize that some people need to be able to harness Sumo Logic search data from within external apps, too. That’s why Sumo Logic also provides a robust RESTful API that you can use to integrate other apps with Sumo Logic search.

To provide a sense of how you can use the Sumo Logic Search Job API in the real world, this post offers a quick primer on the API, along with a couple of examples of the API in action. For more detailed information, refer to the Search Job API documentation.

Sumo Logic Search Integration: The Basics

Before getting started there are a few essentials you should know about the Sumo Logic Search Job API.

First, the API uses the HTTP GET method. That makes it pretty straightforward to build the API into Web apps you may have (or any other type of app that uses the HTTP protocol). It also means you can run queries directly from the CLI using any tool that supports HTTP GET requests, like curl or wget. Sound easy? It is!

Second, queries should be directed to https://api.sumologic.com/api/v1/logs/search. You simply append your GET requests and send them on to the server. (You also need to make sure that your HTTP request contains the parameters for connecting to your Sumo Logic account; for example, with curl, you would specify these using the -u flag, for instance, curl -u user@example.com:VeryTopSecret123 your-search-query).

Third, the server delivers query responses in JSON format. That approach is used because it keeps the search result data formatting consistent, allowing you to manipulate the results easily if needed.

Fourth, know that the Search Job API can return up to one million records per search query. API requests are limited to  four API per second and 240 requests per minute across all API calls from a customer. If the rate is exceeded, a rate limit exceeded (429) error is returned.


Sumo Logic Search API Example Queries

As promised, here are some real-world examples.

For starters, let’s say you want to identify incidents where a database connection failure occurred. To do this, specify “database connection error” as our query, using a command like this:


curl -u user@example.com:VeryTopSecret123 "https://api.sumologic.com/api/v1/logs/search?q=database connection error"

(That’s all one line, by the way.)

You can take things further, too, by adding date and time parameters to the search. For example, if you wanted to find database connection errors that happened between about 1 p.m. and 3 p.m. on April 4, 2012, you would add some extra data to your query, making it look like this:


curl -u user@example.com:VeryTopSecret123 "https://api.sumologic.com/api/v1/logs/search?q=database connection error&from=2012-04-04T13:01:02&to=2012-04-04T15:01:02

Another real-world situation where the search API can come in handy is to find login failures. You could locate those in the logs with a query like this:


curl -u user@example.com:VeryTopSecret123 "https://api.sumologic.com/api/v1/logs/search?q=failed login"

Again, you could restrict your search here to a certain time and date range, too, if you wanted.

Another Way to Integrate with Sumo Logic Search: Webhooks

Most users will probably find the Sumo Logic search API the most extensible method of integrating their apps with log data. But there is another way to go about this, too, which is worth mentioning before we wrap up.

That’s Webhook alerts, a feature that was added to Sumo Logic last fall. Webhooks make it easy to feed Sumo Logic search data to external apps, like Slack, PagerDuty, VictorOps and Datadog. I won’t explain how to use Webhooks in this post, because that topic is already covered on our blog.

Integrating Apps with the Sumo Logic Search API is published by the Sumo Logic DevOps Community. If you’d like to learn more or contribute, visit devops.sumologic.com. Also, be sure to check out Sumo Logic Developers for free tools and code that will enable you to monitor and troubleshoot applications from code to production.

About the Author

Dan Stevens is the founder of StickyWeb (stickyweb.biz), a custom Web Technology development company. Previously, he was the Senior Product Manager for Java Technologies at Sun Microsystems and for broadcast video technologies at Sony Electronics, Accom and Ampex.


How to Configure a Docker Cluster Using Swarm

$
0
0

Docker swarm configurationIf your data center were a beehive, Docker Swarm would be the pheromone that keeps all the bees working efficiently together.

Here’s what I mean by that. In some ways, Docker containers are like bumblebees. Just as an individual bee can’t carry much of anything on her own, a single container won’t have a big impact on your data center’s bottom line.

It’s only by deploying hundreds or thousands of containers in tandem that you can leverage their power, just like a colony of bees prospers because of the collective efforts of each of its individual members.

Unlike bumblebees, however, Docker containers don’t have pheromones that help them coordinate with one another instinctively. They don’t automatically know how to pool their resources in a way that most efficiently meets the needs of the colony (data center). Instead, containers on their own are designed to operate independently.

So, how do you make containers work together effectively, even when you’re dealing with many thousands of them? That’s where Docker Swarm comes in.

Swarm is a cluster orchestration tool for Docker containers. It provides an easy way to configure and manage large numbers of containers across a cluster of servers by turning all of them into a virtual host. It’s the hive mind that lets your containers swarm like busy bees, as it were.

Why Use Swarm for Cluster Configuration?

There are lots of similar cluster orchestration tools beyond Swarm. Kubernetes and Mesos are among the most popular alternatives, but the full list of options is long.

Deciding which orchestrator is right for you is fodder for a different post. I won’t delve too deeply into that discussion here. But it’s worth briefly noting a couple of characteristics about Swarm.

First, know that Swarm happens to be Docker’s homegrown cluster orchestration platform. That means it’s as tightly integrated into the rest of the Docker ecosystem as it can be. If you like consistency, and you have built the rest of your container infrastructure with Docker components, Swarm is probably a good choice for you.

Docker also recently published data claiming that Swarm outperforms Kubernetes. Arguably, the results in that study do not necessarily apply to all real-world data centers. (For a critique of Docker’s performance claims by Kelsey Hightower, an employee of the company — Google — where Kubernetes has its roots, click here.) But if your data center is similar in scale to the one used in the benchmarks, you might find that Swarm performs well for you, too.

Setting Up a Docker Swarm Cluster

Configuring Swarm to manage a cluster involves a little bit of technical know-how. But as long as you have some basic familiarity with the Docker CLI interface and Unix command-line tools, it’s nothing you can’t handle.

Here’s a rundown of the basic steps for setting up a Swarm cluster:

Step 0. Set up hosts. This is more a prerequisite than an actual step. (That’s why I labeled it step 0!) You can’t orchestrate a cluster till you have a cluster to orchestrate. So before all else, create your Docker images — including both the production containers that comprise your cluster and at least one image that you’ll use to host Swarm and related services.

You should also make sure your networking is configured to allow SSH connections to your Swarm image(s), since I’ll use this later on to access them.

Step 1. Install Docker Engine. Docker Engine is a Docker component that lets images communicate with Swarm via a CLI or API. If it’s not already installed on your images, install it with:

curl -sSL https://get.docker.com/ | sh

Then start Engine to listen for Swarm connections on port 2375 with a command like this:

sudo docker daemon -H tcp://0.0.0.0:2375 -H unix:///var/run/docker.sock

Step 2. Create a discovery backend. Next, I need to launch a Docker daemon that Swarm can use to find and authenticate different images that are part of the cluster.

To do this, SSH into an image that you want to use to host the discovery backend. Then run this command:

docker run -d -p 8500:8500 --name=consul progrium/consul -server -bootstrap

This will fire up the discovery backend on port 8500 on the image.

Step 3. Start Swarm. With that out of the way, the last big step is to start the Swarm instance. For this, SSH into the image you want to use to host Swarm. Then run:

docker run -d -p 4000:4000 swarm manage -H :4000 --replication --advertise :4000 consul://

Fill in the and fields in the command above with the IP addresses of the images you used in steps 1 and 2 for setting up Engine and the discovery backend, respectively. (It’s fine if you do all these using the same server, but you can use different ones if you like.)

Step 4. Connect to Swarm. The final step is to connect your client images to Swarm. You do that with a command like this:

docker run -d swarm join --advertise=:2375 consul://:8500

is the IP address of the image, and is the IP from steps 2 and 3 above.

Using Swarm: Commands

The hard part’s done! Once Swarm is set up as per the instructions above, using it to manage clusters is easy. Just run the docker command with the -H flag and the Swarm port number to monitor and control your Swarm instance.

For example, this command would give information about your cluster if it is configured to listen on port 4000:

docker -H :4000 info

You can also use a command like this to start an app on your cluster directly from Swarm, which will automatically decide how best to deploy it based on real-time cluster metrics:

docker -H :4000 run some-app

Getting the Most out of Swarm

Here are some quick pointers for getting the best performance out of Swarm at massive scale:

  • Consider creating multiple Swarm managers and nodes to increase reliability.
  • Make sure your discovery backend is running on a highly available image, since it needs to be up for Swarm to work.
  • Lock down networking so that connections are allowed only for the ports and services (namely, SSH, HTTP and the Swarm services themselves) that you need. This will increase security.
  • If you have a lot of nodes to manage, you can use a more sophisticated method for allowing Swarm to discover them. Docker explains that in detail here.

If you’re really into Swarm, you might also want to have a look at the Swarm API documentation. The API is a great resource if you need to build custom container-based apps that integrate seamlessly with the rest of your cluster (and that don’t already have seamless integration built-in, like the Sumo Logic log collector does).

How to Configure a Docker Cluster Using Swarm is published by the Sumo Logic DevOps Community. If you’d like to learn more or contribute, visit devops.sumologic.com. Also, be sure to check out Sumo Logic Developers for free tools and code that will enable you to monitor and troubleshoot applications from code to production.

About the Author

Hemant Jain is the founder and owner of Rapidera Technologies, a full service software development shop. He and his team focus a lot on modern software delivery techniques and tools. Prior to Rapidera he managed large scale enterprise development projects at Autodesk and Deloitte.

Data Analytics and Microsoft Azure

$
0
0

Microsoft Azure is the software giant’s offering for modern cloud applications

Today plenty of businesses still have real concerns about migrating applications to the cloud. Fears about network security, availability, and potential downtime swirl through the heads of chief decision makers, sometimes paralyzing organizations into standing pat on existing tech–even though it’s aging by the minute.

Enter Microsoft Azure, the industry leader’s solution for going to a partially or totally cloud-based architecture. Below is a detailed look at what Azure is, the power of partnering with Microsoft for a cloud or hybrid cloud solution, and the best way to get full and actionable visibility into your aggregated logs and infrastructure metrics so your organization can react quickly to opportunities.

What is Microsoft Azure?

Microsoft has leveraged its constantly-expanding worldwide network of data centers to create Azure, a cloud platform for building, deploying, and managing services and applications, anywhere. Azure lets you add cloud capabilities to your existing network through its platform as a service (PaaS) model, or entrust Microsoft with all of your computing and network needs with Infrastructure as a Service (IaaS). Either option provides secure, reliable access to your cloud hosted data–one built on Microsoft’s proven architecture.

Azure provides an ever expanding array of products and services designed to meet all your needs through one convenient, easy to manage platform. Below are just some of the capabilities Microsoft offers through Azure and tips for determining if the Microsoft cloud is the right choice for your organization.

What can Microsoft Azure Do?

Azure Logging

Microsoft maintains a growing directory of Azure services, with more being added all the time. All the elements necessary to build a virtual network and deliver services or applications to a global audience are available, including:

  • Virtual machines. Create Microsoft or Linux virtual machines (VMs) in just minutes from a wide selection of marketplace templates or from your own custom machine images. These cloud-based VMs will host your apps and services as if they resided in your own data center.
  • SQL databases. Azure offers managed SQL relational databases, from one to an unlimited number, as a service. This saves you overhead and expenses on hardware, software, and the need for in-house expertise.
  • Azure Active Directory Domain services. Built on the same proven technology as Windows Active Directory, this service for Azure lets you remotely manage group policy, authentication, and everything else. This makes moving and existing security structure partially or totally to the cloud as easy as a few clicks.
  • Application services. With Azure it’s easier than ever to create and globally deploy applications that are compatible on all popular web and portable platforms. Reliable, scalable cloud access lets you respond quickly to your business’s ebb and flow, saving time and money. With the introduction of Azure WebApps to the Azure Marketplace, it’s easier than ever to manage production, testing and deployment of web applications that scale as quickly as your business. Prebuilt APIs for popular cloud services like Office 365, Salesforce and more greatly accelerate development.
  • Visual Studio team services. An add-on service available under Azure, Visual Studio team services offer a complete application lifecycle management (ALM) solution in the Microsoft cloud. Developers can share and track code changes, perform load testing, and deliver applications to production while collaborating in Azure from all over the world. Visual Studio team services simplify development and delivery for large companies or new ones building a service portfolio.
  • Storage. Count on Microsoft’s global infrastructure to provide safe, highly accessible data storage. With massive scalability and an intelligent pricing structure that lets you store infrequently accessed data at a huge savings, building a safe and cost-effective storage plan is simple in Microsoft Azure.

Microsoft continues to expand its offerings in the Azure environment, making it easy to make a la carte choices for the best applications and services for your needs.

Why are people trusting their workloads to Microsoft Azure?

Two-thirds of Fortune 500 companies trust Microsoft Azure platform for their critical workloads.

It’s been said that the on-premise data center has no future. Like mainframes and dial-up modems before them, self-hosted data centers are becoming obsolete, being replaced by increasingly available and affordable cloud solutions.

Several important players have emerged in the cloud service sphere, including Amazon Web Services (AWS), perennial computing giant IBM, and Apple’s ubiquitous iCloud, which holds the picture memories and song preferences of hundreds of millions of smartphone users, among other data. With so many options, why are companies like 3M, BMW, and GE moving workloads to Microsoft Azure? Just some of the reasons:

  • Flexibility. With Microsoft Azure you can spin up new services and geometrically scale your data storage capabilities on the fly. Compare this to a static data center, which would require new hardware and OS purchasing, provisioning, and deployment before additional power could be brought to bear against your IT challenges. This modern flexibility makes Azure a tempting solution for organizations of any size.
  • Cost. Azure solutions don’t just make it faster and easier to add and scale infrastructure, they make it cheaper. Physical services and infrastructure devices like routers, load balancers and more quickly add up to thousands or even hundreds of thousands of dollars. Then there’s the IT expertise required to run this equipment, which amounts to major payroll overhead. By leveraging Microsoft’s massive infrastructure and expertise, Azure can trim our annual IT budget by head-turning percentages.
  • Applications. With a la carte service offerings like Visual Studio Team Services, Visual Studio Application Insights, and Azure’s scalable, on-demand storage for both frequently accessed and ‘cold’ data, Microsoft makes developing and testing mission-critical apps a snap. Move an application from test to production mode on the fly across a globally distributed network. Microsoft also offers substantial licensing discounts for migrating their existing apps to Azure, which represents even more opportunity for savings.
  • Disaster recovery. Sometimes the unthinkable becomes the very immediate reality. Another advantage of Microsoft Azure lay in its high-speed and geographically decentralized infrastructure, which creates limitless options for disaster recovery plans. Ensure that your critical application and data can run from redundant sites during recovery periods that last minutes or hours instead of days. Lost time is lost business, and with Azure you can guarantee continuous service delivery even when disaster strikes.

The combination of Microsoft’s vast infrastructure, constant application and services development, and powerful presence in the global IT marketplace has made Microsoft Azure solutions the choice of two-thirds of the world’s Fortune 500 companies. But the infinite scalability of Azure can make it just as right for your small personal business.

Logging capabilities within Microsoft Azure

There’s gold in those logs. Microsoft Azure offers logging and metrics that can help you improve performance.

The secret gold mine of any infrastructure and service solution is ongoing operational and security visibility, and ultimately these comes down to extracting critical log and infrastructure metrics from the application and underlying stack. The lack of this visibility is like flying a plane blind—no one does it. Azure comes with integrated health monitoring and alert capabilities so you can know in an instant if performance issues or outages are impacting your business. Set smart alert levels for events from:

  • Azure diagnostic infrastructure logs. Get current insights into how your cloud network is performing and take action to resolve slow downs, bottlenecks, or service failures.
  • Windows IIS logs. View activity on your virtual web servers and respond to traffic patterns or log-in anomalies with the data Azure gathers on IIS 7.
  • Crash dumps. Even virtual machines can ‘blue screen’ and other virtual equipment crashes can majorly disrupt your operations. With Microsoft Azure you can record crash dump data and troubleshoot to avoid repeat problems.
  • Custom error logs. Set Azure alerts to inform you about defined error events. This is especially helpful when hosting private applications that generate internal intelligence about operations, so you can add these errors to the health checklist Azure maintains about your network.

Microsoft Azure gives you the basic tools you need for error logging and monitoring, diagnostics, and troubleshooting to ensure continuous service delivery in your Azure cloud environment.

Gain Full Visibility into Azure with Unified Logs and Metrics

Sumo Logic brings unparalleled visualizations and actionable insights to your Microsoft Azure infrastructure so you can see and respond to changes in real-time. Even with Azure’s native logging and analytics tools, the vast amount of data flowing to make your network and applications operate can be overwhelming. The volume, variety and velocity of cloud data should not be underestimated. With the help of Sumo Logic, a trusted Microsoft partner, managment of that data is simple.

The Sumo Logic platform unifies logs and metrics from the structured, semi-structured, and unstructured data across your entire Microsoft environment. Machine learning algorithms process vast amounts of log and metrics data, looking for anomalies and deviations from normal patterns of activity, alerting you when appropriate. With Log Reduce, Log Compare and Outlier Detection, extract continuous intelligence from your application stack and proactively respond to operational and security issues.

The Sumo Logic apps for Microsoft Azure Audit, Microsoft Azure Web Apps, Microsoft Windows Server Active Directory, Microsoft Internet Information Services (IIS), and the popular Windows Performance app,  make ingesting machine data in real-time and rendering it into clear, interactive visualizations for a complete picture of your applications and data.

Sumo Logic provides real-time data and full visibility

Before long the on-premise data center—along with its expensive hardware and hordes of local technicians on the payroll—may be lost to technology’s graveyard. But smart, researched investment into cloud capabilities like those provided in Microsoft Azure will make facing tomorrow’s bold technology challenges and possibilities relatively painless.

Optimizing AWS Lambda Cost and Performance Through Monitoring

$
0
0

AWS_Lambda_Sumo_Logic_Function
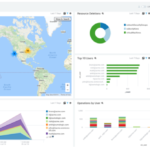
In this post, I’ll be discussing the use of monitoring as a tool to optimize the cost and performance of AWS Lambda. I’ve worked on a number of teams, and almost without exception, the need to put monitoring in place has featured prominently in early plans. Tickets are usually created and discussed, and then placed in the backlog, where they seem to enter a cycle of being important—but never quite enough to be placed ahead of the next phase of work.

In reality, especially in a continuous development environment, monitoring should be a top priority, and with the tools available in AWS and organizations like Sumo Logic, setting up basic monitoring shouldn’t take more than a couple of hours, or a day at most.

What exactly is AWS Lambda?

AWS Lambda from Amazon Web Services (AWS) allows an organization to introduce functionality into the AWS ecosystem without the need to provision and maintain servers. A Lambda function can be uploaded and configured, and then can be executed as frequently as needed without further intervention.

Contrary to a typical server environment, you don’t have any control, nor do you require insight into the data elements like CPU usage or available memory, and you don’t have to worry about scaling your functionality to meet increased demand. Once a Lambda has been deployed, the cost is based on the number of requests and a few key elements we’ll discuss shortly.

How to setup AWS Lambda monitoring, and what to track

Before we get into how to set up monitoring and what data elements should be tracked, it is vital that you put an effective monitoring system in place. And with that decision made, AWS helps you right from the start. Monitoring is handled automatically by AWS Lambda, which means less time configuring and more time analyzing results. Logs are automatically sent to Amazon Cloudwatch where a user can view basic metrics, or harness the power of an external reporting system, and gain key insights into how Lambda is performing. The Sumo Logic App for AWS Lambda uses the Lambda logs via CloudWatch and visualizes operational and performance trends about all the Lambda functions in your account, providing insight into executions such as memory and duration usage, broken down by function versions or aliases.

The pricing model for functionality deployed using AWS Lambda is calculated by the number of requests received, and the time and resources needed to process the request. Therefore, the key metrics that need to be considered are:

  • Number of requests and associated error counts.
  • Resources required for execution.
  • Time required for execution or latency.
  • Request and error counts in Lambda

The cost per request is the simplest of the three factors. In the typical business environment, the goal is to drive traffic to the business’ offerings; thus, increasing the number of requests is key. Monitoring of these metrics should compare the number of actual visitors with the number of requests being made to the function. Depending on the function and how often a user is expected to interact with it, you can quickly determine what an acceptable ratio might be—1:1 or 1:3. Variances from this should be investigated to determine what the cause might be.

Lambda Resources usage and processing time

When Lambda is first configured, you can specify the expected memory usage of the function. The actual runtime usage may differ, and is reported on a per-request basis. Amazon then factors the cost of the request based on how much memory is used, and for how long. The latency is based on 100ms segments.

If, for example, you find that your function typically completes in a time between 290ms and 310ms, there would be a definite cost savings if the function could be optimized to perform consistently in less than 300ms. These optimizations, however, would need to be analyzed to determine whether they increase resource usage for that same time, and if that increase in performance is worth an increase in cost.

For more information on how Amazon calculates costs relative to resource usage and execution time, you can visit the AWS Lambda pricing page.

AWS Lambda: The big picture

Finally, when implementing and considering metrics, it is important to consider the big picture. One of my very first attempts with a Lambda function yielded exceptional numbers with respect to performance and utilization of resources. The process was blazingly fast, and barely used any resources at all. It wasn’t until I looked at the request and error metrics that I realized that over 90% of my requests were being rejected immediately.

While monitoring can’t make your business decisions for you, having a solid monitoring system in place will give an objective view of how your functions are performing, and data to support the decisions you need to make for your business.

About the Author

Mike Mackrory is a Global citizen who has settled down in the Pacific Northwest – for now. By day he works as a Senior Engineer on a Quality Engineering team and by night he writes, consults on several web based projects and runs a marginally successful eBay sticker business. When he’s not tapping on the keys, he can be found hiking, fishing and exploring both the urban and the rural landscape with his kids. Always happy to help out another developer, he has a definite preference for helping those who bring gifts of gourmet donuts, craft beer and/or Single-malt Scotch.

Using Logs to Speed Your DevOps Workflow

$
0
0

Using Logs to Speed Your DevOps Workflow - Sumo LogicLog aggregation and analytics may not be a central part of the DevOps conversation. But effective use of logs is key to leveraging the benefits associated with the DevOps movement and the implementation of continuous delivery.

Why is this the case? How can organizations take advantage of logging to help drive their DevOps workflow? Keep reading for a discussion of how logging and DevOps fit together.

Defining DevOps

If you are familiar with DevOps, you know that it’s a new (well, new as of the past five years or so) philosophy of software development and delivery. It prioritizes the following goals:

  • Constant communication. DevOps advocates the removal of “silos” between different teams. That way, everyone involved in development and delivery, from programmers to QA folks to production-environment admins, can collaborate readily and remain constantly aware of the state of development.
  • Continuous integration and delivery. Rather than making updates to code incrementally, DevOps prioritizes a continuous workflow. Code is updated continuously, the updates are tested continuously, and validated code is delivered to users continuously.
  • Flexibility. DevOps encourages organizations to use whichever tool is the best for solving a particular challenge, and to update tool sets regularly as new solutions emerge. Organizations should not wed themselves to a particular framework.
  • Efficient testing. Rather than waiting until code is near production to test it, DevOps prioritizes testing early in the development cycle. (This strategy is sometimes called “shift-left” testing.) This practice assures that problems are discovered when the time required to fix them is minimal, rather than waiting until they require a great deal of back peddling.

DevOps and Logging

None of the goals outlined above deal with logging specifically. And indeed, because DevOps is all about real-time workflows and continuous delivery, it can be easy to ignore logging entirely when you’re trying to migrate to a DevOps-oriented development strategy.

Yet logs are, in fact, a crucial part of an efficient DevOps workflow. Log collection and analysis help organizations to optimize their DevOps practices in a number of ways.

Consider how log aggregation impacts the following areas.

Communication and Workflows in DevOps

Implementing effective communication across your team is about more than simply breaking down silos and ensuring that everyone has real-time communication tools available. Logs also facilitate efficient communication. They do this in two ways.

First, they maximize visibility into the development process for all members of the team. By aggregating logs from across the delivery pipeline—from code commits to testing logs to production server logs—log analytics platforms assure that everyone can quickly locate and analyze information related to any part of the development cycle. That’s crucial if you want your team members to be able to remain up to speed with the state of development.

Second, log analytics help different members of the organization understand one another. Your QA team is likely to have only a basic ability to interpret raw code commits. Your programmers are not specialists in reading test results. Your admins, who deploy software into production, are experts in only that part of the delivery pipeline.

Log analytics, however, can be used to help any member of the team interpret data associated with any part of the development process. Rather than having to understand raw data from a part of the workflow with which they are not familiar, team members can rely on analytics results to learn what they need quickly.

Continuous visibility

To achieve continuous delivery, you need to have continuous visibility into your development pipeline. In other words, you have to know, on a constant, ongoing basis, what is happening with your code. Otherwise, you’re integrating in the dark.

Log aggregation and analytics help deliver continuous visibility. They provide a rich source of information about your pipeline at all stages of development. If you want to know the current quality and stability of your code, for example, you can quickly pull analytics from testing logs to find that information. If you want to know how your app is performing in production, you can do the same with server logs.

Flexibility from log analytics

In order to switch between development frameworks and programming languages at will, you have to ensure that moving between platforms requires as little change as possible to your overall workflow. Without log aggregation, however, you’ll have to overhaul the way you store and analyze logs every time you add or subtract a tool from your pipeline.

A better approach is to use a log aggregation and analytics platform like Sumo Logic. By supporting a wide variety of logging configurations, Sumo Logic assures that you can modify your development environment as needed, while keeping your logging solution constant.

Faster testing through log analytics

Performing tests earlier in the development cycle leads to faster, more efficient delivery only if you are able to fix the problems discovered by tests quickly. Otherwise, the bugs that your tests reveal will hold up your workflow, no matter how early the bugs are found.

Log analytics are a helpful tool for getting to the bottom of bugs. By aggregating and analyzing logs from across your pipeline, you can quickly get to the source of a problem with your code. Logs help keep the continuous delivery pipeline flowing smoothly, and maximize the value of shift-left testing.

Moving Towards a DevOps Workflow

Log aggregation and analytics may not be the first things that come to mind when you think of DevOps. But effective collection and interpretation of log data is a crucial part of achieving a DevOps-inspired workflow.

Logging on its own won’t get you to continuous delivery, of course. That requires many other ingredients, too. But it will get you closer if you’re not already there. And if you are currently delivering continuously, effective logging can help to make your pipeline even faster and more efficient.

Using Logs to Speed Your DevOps Workflow API Workflows is published by the Sumo Logic DevOps Community. If you’d like to learn more or contribute, visit devops.sumologic.com. Also, be sure to check out Sumo Logic Developers for free tools and code that will enable you to monitor and troubleshoot applications from code to production.

About the Author

Chris Tozzi has worked as a journalist and Linux systems administrator. He has particular interests in open source, agile infrastructure and networking. He is Senior Editor of content and a DevOps Analyst at Fixate IO.

Integrate Azure Function with Sumo Logic Schedule Search

$
0
0

Azure Functions

Azure Azure Functionsfunctions are event driven pieces of code that can used to integrate systems, build APIs, process data and trigger any action/reaction to events without having to worry about infrastructure to run it.
More info on Azure functions can be found here.


Sumo Logic Scheduled Search

Scheduled searches are standard saved searches that are executed on a schedule you set. Once configured, scheduled searches run continuously, making them a great tool for continuously monitoring your stack, infrastructure, process, build environment, etc.

Why integrate Sumo Logic Scheduled Search with Azure Function?

Answer is very simple: Using Sumo Logic’s machine learning algorithm and search capabilities, you can Monitor and alert on key metrics and KPIs in real time to rapidly identify problems, detect outliers, abnormal behavior using dynamic thresholds or any other event which is important for you. Once you have detected the event for your use case, you can have the Azure function respond to your event and take an appropriate action.

More info on real time monitoring using Sumo Logic can be found here.

Three Steps guide to Integrate Azure Function with Sumo Logic Schedule Search.

Case in point: Web app scheduled search detects an outage -> Sumo Logic triggers Azure Function via Webhook Connection –> Azure function gets executed, and takes preventive/corrective action.

Step 1: Create Azure Function and write the preventive/corrective action you want to take.

1
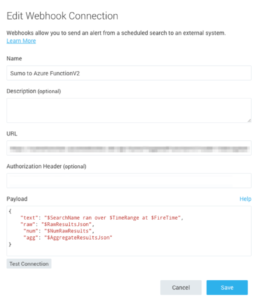
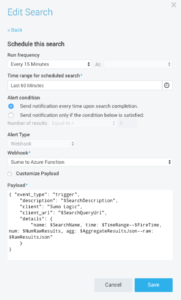
Step 2: Set up Sumo Logic Webhook Connection which will trigger Azure Function created in #1. To set up connection, follow the steps under ‘Setting up Webhook Connections

2

Step 3: Create a Schedule Search that will monitor your infrastructure for any outage, call the Webhook connection created in #2.

3

Example

Sumo Logic with it’s machine learning capabilities can detect an outlier in incoming traffic. Given a series of time-stamped numerical values, using the Sumo Logic’s Outlier operator in a query can identify values in a sequence that seem unexpected, and would identify an alert or violation, for example, for a scheduled search. To do this, the Outlier operator tracks the moving average and standard deviation of the value, and detects or alerts when the difference between the value exceeds mean by some multiple of standard deviation, for example, 3 standard deviation.

In this example, we want to trigger an Azure Function whenever there is an outlier in incoming traffic for Azure Web Apps.

4


Step 1: Create an Azure function – for this example I have following Node.js function

#r "Newtonsoft.Json"
using System;
using System.Net;
using Newtonsoft.Json;

public static async Task&amp;amp;amp;amp;amp;lt;object&amp;amp;amp;amp;amp;gt; Run(HttpRequestMessage req, TraceWriter log)
{
    log.Info($"Webhook was triggered Version 2.0!");
    string jsonContent = await req.Content.ReadAsStringAsync();
    dynamic data = JsonConvert.DeserializeObject(jsonContent);
    log.Info($"Webhook was triggered - TEXT: {data.text}!");
    log.Info($"Webhook was triggered - RAW : {data.raw} !");
    log.Info($"Webhook was triggered - NUM : {data.num} !");
    log.Info($"Webhook was triggered - AGG : {data.agg}!");
   /* Add More Logic to handle an outage */
    return req.CreateResponse(HttpStatusCode.OK, new {
        greeting = $"Hello"
    });
}

Copy and paste Function Url in a separate notepad, you will need this in Step 2

Step 2: Create Sumo Logic Webhook Connection.

From your Sumo Logic account: Go to Manage -> Connections, Click Add and then click Webhook.

        1. Provide appropriate name and Description.
        2. Copy paste the Azure Function Url (from step #1) in URL field.
        3. For Payload, add following JSON.
        4. Test connection, and Save it.
{
    "text": "$SearchName ran over $TimeRange at $FireTime",
    "raw": "$RawResultsJson",
     "num": "$NumRawResults",
     "agg": "$AggregateResultsJson"
}

Step 3: Create a Schedule Search.

Scheduled searches are saved searches that run automatically at specified intervals. When a scheduled search is configured to send an alert, it can be sent to another tool via a Webhook Connection.

From your Sumo Logic account, copy paste following search and click Save As

_sourceCategory=Azure/webapp
| parse regex "\d+-\d+-\d+ \d+:\d+:\d+ (?&amp;amp;amp;amp;lt;s_sitename&amp;amp;amp;amp;gt;\S+) (?&amp;amp;amp;amp;lt;cs_method&amp;amp;amp;amp;gt;\S+) (?&amp;amp;amp;amp;lt;cs_uri_stem&amp;amp;amp;amp;gt;\S+) (?&amp;amp;amp;amp;lt;cs_uri_query&amp;amp;amp;amp;gt;\S+) (?&amp;amp;amp;amp;lt;src_port&amp;amp;amp;amp;gt;\S+) (?&amp;amp;amp;amp;lt;src_user&amp;amp;amp;amp;gt;\S+) (?&amp;amp;amp;amp;lt;client_ip&amp;amp;amp;amp;gt;\S+) (?&amp;amp;amp;amp;lt;cs_user_agent&amp;amp;amp;amp;gt;\S+) (?&amp;amp;amp;amp;lt;cs_cookie&amp;amp;amp;amp;gt;\S+) (?&amp;amp;amp;amp;lt;cs_referrer&amp;amp;amp;amp;gt;\S+) (?&amp;amp;amp;amp;lt;cs_host&amp;amp;amp;amp;gt;\S+) (?&amp;amp;amp;amp;lt;sc_status&amp;amp;amp;amp;gt;\S+) (?&amp;amp;amp;amp;lt;sc_substatus&amp;amp;amp;amp;gt;\S+) (?&amp;amp;amp;amp;lt;sc_win32_status&amp;amp;amp;amp;gt;\S+) (?&amp;amp;amp;amp;lt;sc_bytes&amp;amp;amp;amp;gt;\S+) (?&amp;amp;amp;amp;lt;cs_bytes&amp;amp;amp;amp;gt;\S+) (?&amp;amp;amp;amp;lt;time_taken&amp;amp;amp;amp;gt;\S+)"
| timeslice 5m
| count by _timeslice
| outlier _count
| where _count_violation=1

Note: This assumes you have _sourceCategory set up with Azure/webapp. If you don’t have this source set up, then you can use your own search to schedule it.

5

  • In the Save Search As dialog, enter a name for the search and an optional description.
  • Click Schedule this search.
  • Choose 60 Minutes for Run Frequency
  • Last 60 Minutes for Time range for scheduled search
  • For Alert condition, choose Send notification only if the condition below is satisfied
  • Number of results Greater than > 0
  • For Alert Type choose Webhook
  • For Webhook, choose the Webhook connection you created in Step 2 from dropdown.
  • Click Save

Depending upon Run Frequency of your scheduled search, you can check the logs of your Azure function from portal to confirm it got triggered.

2016-08-25T20:50:36.349 Webhook was triggered Version 2.0!
2016-08-25T20:50:36.349 Webhook was triggered - TEXT: Malicious  Client ran over 2016-08-25 19:45:00 UTC - 2016-08-25 20:45:00 UTC at 2016-08-25 20:45:00 UTC!
2016-08-25T20:50:36.349 Webhook was triggered - RAW :  !
2016-08-25T20:50:36.349 Webhook was triggered - NUM : 90 !
2016-08-25T20:50:36.351 Webhook was triggered - AGG : [{"Approxcount":13,"client_ip":"60.4.192.44"},{"Approxcount":9,"client_ip":"125.34.187"},{"Approxcount":6,"client_ip":"62.64.0.1"},{"Approxcount":6,"client_ip":"125.34.14"}]!
2016-08-25T20:50:36.351 Function completed (Success, Id=72f78e55-7d12-49a9-aa94-8bb347f72672)
2016-08-25T20:52:25  No new trace in the past 1 min(s).
2016-08-25T20:52:49.248 Function started (Id=d22f92cf-0cf7-4ab2-ad0e-fa2f23e25e09)
2016-08-25T20:52:49.248 Webhook was triggered Version 2.0!
2016-08-25T20:52:49.248 Webhook was triggered - TEXT: Errors Last Hour ran over 2016-08-25 19:45:00 UTC - 2016-08-25 20:45:00 UTC at 2016-08-25 20:45:00 UTC!
2016-08-25T20:52:49.248 Webhook was triggered - RAW :  !
2016-08-25T20:52:49.248 Webhook was triggered - NUM : 90 !
2016-08-25T20:52:49.248 Webhook was triggered - AGG : [{"server_errors":39.0}]!
2016-08-25T20:52:49.248 Function completed (Success, Id=d22f92cf-0cf7-4ab2-ad0e-fa2f23e25e09)

Summary

We created a scheduled search which runs every 60 minutes, to find an outlier in last 60 minutes of incoming traffic data. If there is an outlier, webhook connection gets activated and triggers Azure function.

More Reading

Building Great Alerts

  • Actionable – there should be a playbook for every alert received
  • Directed – there should be an owner to follow the playbook
  • Dynamic – Static thresholds can have “false positives”
Viewing all 1036 articles
Browse latest View live