756 ‘real’ emails this week, 3200+ more generated by machines and approximately 78,000 push notifications, todos, Jira tasks and text messages – all asking for a piece of your attention. Oh, did you want to get some work done? There’s also a line of people waiting to interrupt you or ask someone near you a question while you’re mentally skydiving through the 17-layer-dip that is your source base. One more little sound and it all vanishes from your memory.
But we’re not actually going to talk about cats (much) or their noises. Today let’s battle the noise that is your infrastructure. Have you ever tried setting up an alert on some key performance indicator (or KPI as so many like to say)? It’s easy – alert me when the request volume goes over 6000. Per node. Wait, no – per cluster. Ok, 14000 per cluster. No, 73333 per balancer. Ok, now 87219. Nevermind, I never want to wake up for this ever again – just alert me if the entire service stops existing. Done.
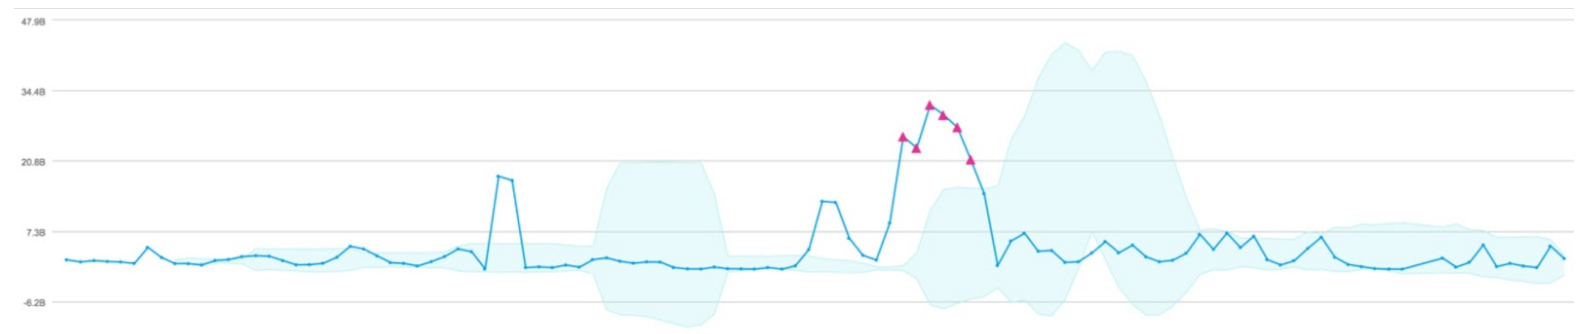
Luckily I have a great solution for you! Today, right now even, you can parse out your favorite KPI and run a simple operator to find points in time where that indicator exceeds a dynamic and mathematically awesome boundary to tell you with so much likelihood that something important actually happened. That new operator is called Outlier and it does exactly what you hope it does. Let’s look at an example:
parse “bytes: *,” as bytes
| timeslice 5m
| sum(bytes) as sumbytes by _timeslice
| outlier sumbytes
You’ve already done the first 3 lines yourself many times but that last line does all this extra magic for you, showing you exactly where the thing went off the rails. What’s more, you can even tune this to meet your needs by looking for a sustained change (the ‘consecutive’ parameter), a positive change only (‘direction’ parameter) and even the size of the thresholds shown here with blue shading (the ‘threshold’ parameter).
Our documentation will help you get the most out of this great new operator but before we move on, you should also note that you can use this to identify outliers across multiple streams of data with a single query. This means you can get an alert if one of your deployments or hosts goes outside of it’s thresholds – where those thresholds are dynamic and specific to that deployment/host!
parse “bytes: *,” as bytes
| timeslice 5m
| sum(bytes) as sumbytes by _timeslice, _sourceHost
| outlier sumbytes by _sourceHost
| where _sumbytes_violation=1
That last line is the logic you need to eliminate the non-outliers and then all you need to do is setup a saved search alert to get your noise-free alerts going. Use the conditional alert where the number of results > 0 and you’ll only see alerts when you have a real problem! And when it turns out that you get a spurious alert anyway, you can always come back and adjust threshold, consecutive, direction and window to make things right again.
And now, with no shyness about the abrupt segue, how would you like to see into the future as well? Well I can help with that too – the new Predict operator will show you a linear projection into the future. Now that you’ve become a master of alerts with Outlier, just imagine what sort of power you can wield by getting an alert before your disk fills up on your DB box.

Just as with Outlier, you can configure a scheduled search alert to become the ultimate master of DevOps while befriending unicorns and defying flying tacos. But just to be clear – you’ll get that alert before the outage begins so that you can avoid posting awful things on your status page and filing post mortems with your managers. This is why people will assume you’re magical.
As always, the documentation is an amazing place to get started, but for now I’ll leave you with this example and kindly ask that you get in touch to let us know what you think after you’ve tried out these two fantastic operators!
…| parse “diskfree: *,” as diskfree
| timeslice 5m
| sum(diskfree) as sum_disk by _timeslice
| predict sum_disk by 5m forecast=20
The post No. More. Noise. appeared first on Sumo Logic.